Loading
Introduction to creating annotations
Prerequisites
FusionCharts Suite XT includes a wide range of charts, gauges, and maps that you can use to plot static as well as real-time data. Annotations, a compelling feature of the product, lets you make your charts self-descriptive and visually engaging.
This article:
-
Tells you about the different types of annotation items available
-
Describes the objects used to create annotations
Annotation Items
Annotations are graphical elements-text, images, shapes-that you can use to customize your chart.
You can add the following types of annotations to your chart:
-
Text (custom notes, labels, or paragraphs of text)
-
Image (external images)
-
Shapes (rectangle, polygon, circle, arc, and line)
-
Path connectors (free-form arrows, connectors, callouts, and so on)
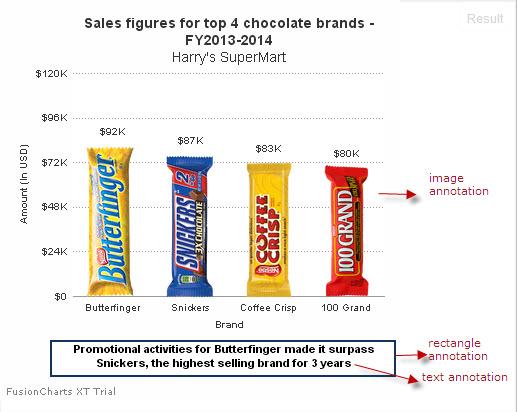
The image of a chart rendered with different types of annotations items is shown below:

The basic JSON structure to create annotations is shown below:
{
    "chart": {
        ...
    },
    "annotations": {
        "groups": [{
        		//Annotation group 1
            	//Define a unique identification string for the group.
                "items": [
                	//Define individual annotation items.
                    {//Annotation Item 1},
                    {//Annotation Item 2},
                    ...
                    {//Annotation Item *n*}
                ]
            }, {
            	//Annotation group 2
            	//Define a unique identification string for the group.
                "items": [
                	//Define individual annotation items.
                	{//Annotation Item 1},
                	{//Annotation Item 2},
                	...
                    {//Annotation Item *n*}
                ]
            },
            ...
             {
            	//Annotation group *n*
            	//Define a unique identification string for the group.
                "items": [
                	//Define individual annotation items.
                    {//Annotation Item 1},
                    {//Annotation Item 2},
                    ...
                    {//Annotation Item *n*}
                ]
            },
        ]
    }
}
Objects Used to Create Annotations
The annotations, groups, and items objects are used to create annotations.
A brief description of these objects is given in the table below:
| Object | Description |
|---|---|
|
An object that encompasses all the code for generating annotations. |
|
An object array that consolidates multiple annotations into one group. You can create multiple annotation groups for one chart. Grouping annotations is useful when a complex graphic is created using individual annotation items. This is covered in detail in the subsequent articles. |
|
An object array that defines individual annotation items that will be contained in one annotation group. |
To know how to create the different types of annotations, refer the following articles: