Demos

Beginner's Guide

Charts / Gauges / Maps Guide

Customizing Charts

API

Integrating With Your Stack

Help

Loading

A legend is a chart element that is used to display the series name of each dataset in multi-series/combination charts. Legends are not applicable to single series charts. Legends are used to correlate a data plot to its series name using its color.

In the chart below - notice the legend below the x-axis which helps identify the series name.

Configuring Your Chart - Legend

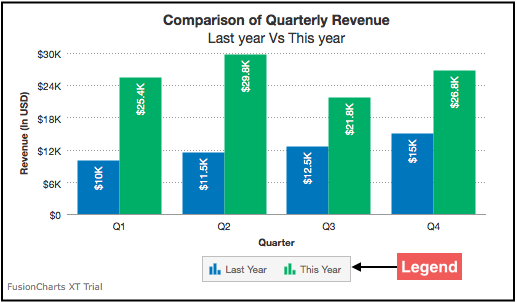
Each series is represented by it’s own icon in the legend.

In FusionCharts Suite XT, legends are interactive by default. Each legend icon when clicked, shows or hides the dataset series corresponding to that item.

This article talks about:

  • Setting legend position

  • Configuring legend icon size

  • Drawing a custom legend icon

  • Customizing legend scroll bar

  • Reversing legend order

  • Hiding legend

  • Hiding series upon loading

  • Customizing legend appearance

  • Customizable legend font cosmetics

Setting legend position

A multi-series column 2D chart with legend position changed to right looks as below:

FusionCharts will load here..

The attribute to set legend position is as mentioned below.

Attribute Name Description

legendPosition

The legend can be plotted at two positions on the chart - below the chart for value bottom and to the right of the chart for value right.

legendAllowDrag

The legend can be made drag-able by setting this attribute to 1. Set this to 0 (default) to disable dragging.

The data structure needed to change legend position in a chart is given below:

{ "chart": { "caption": "Comparison of Quarterly Revenue", "subCaption": "Last year Vs This year", "xAxisname": "Quarter", "yAxisName": "Revenue (In USD)", "numberPrefix": "$", "theme": "fint", "legendPosition": "right" }, "categories": [ { "category": [ { "label": "Q1" }, { "label": "Q2" }, { "label": "Q3" }, { "label": "Q4" } ] } ], "dataset": [ { "seriesname": "Last Year", "data": [ { "value": "10000" }, { "value": "11500" }, { "value": "12500" }, { "value": "15000" } ] }, { "seriesname": "This Year", "data": [ { "value": "25400" }, { "value": "29800" }, { "value": "21800" }, { "value": "26800" } ] } ] }
{
    "chart": {
        "caption": "Comparison of Quarterly Revenue",
        "subCaption": "Last year Vs This year",
        "xAxisname": "Quarter",
        "yAxisName": "Revenue (In USD)",
        "numberPrefix": "$",
        "theme": "fint",
        "legendPosition": "right"
    },
    "categories": [
        {
            "category": [
                {
                    "label": "Q1"
                },
                {
                    "label": "Q2"
                },
                {
                    "label": "Q3"
                },
                {
                    "label": "Q4"
                }
            ]
        }
    ],
    "dataset": [
        {
            "seriesname": "Last Year",
            "data": [
                {
                    "value": "10000"
                },
                {
                    "value": "11500"
                },
                {
                    "value": "12500"
                },
                {
                    "value": "15000"
                }
            ]
        },
        {
            "seriesname": "This Year",
            "data": [
                {
                    "value": "25400"
                },
                {
                    "value": "29800"
                },
                {
                    "value": "21800"
                },
                {
                    "value": "26800"
                }
            ]
        }
    ]
}

Configuring legend icon size

A multi-series column 2D chart with legend icon size changed to ‘2’ looks as below:

FusionCharts will load here..

The attribute to configure legend icon size is detailed below:

Attribute Name Description

legendIconScale

Scaling of legend icon is possible in FusionCharts XT. This attribute lets you control the size of legend icon with valid values from 1 (100%) to 5 (500%).

The data used, in the chart above, to change legend icon size in a chart is as given below:

{ "chart": { "caption": "Comparison of Quarterly Revenue", "subCaption": "Last year Vs This year", "xAxisname": "Quarter", "yAxisName": "Revenue (In USD)", "numberPrefix": "$", "theme": "fint", "legendIconScale": "2" }, "categories": [ { "category": [ { "label": "Q1" }, { "label": "Q2" }, { "label": "Q3" }, { "label": "Q4" } ] } ], "dataset": [ { "seriesname": "Last Year", "data": [ { "value": "10000" }, { "value": "11500" }, { "value": "12500" }, { "value": "15000" } ] }, { "seriesname": "This Year", "data": [ { "value": "25400" }, { "value": "29800" }, { "value": "21800" }, { "value": "26800" } ] } ] }
{
    "chart": {
        "caption": "Comparison of Quarterly Revenue",
        "subCaption": "Last year Vs This year",
        "xAxisname": "Quarter",
        "yAxisName": "Revenue (In USD)",
        "numberPrefix": "$",
        "theme": "fint",
        "legendIconScale": "2"
    },
    "categories": [
        {
            "category": [
                {
                    "label": "Q1"
                },
                {
                    "label": "Q2"
                },
                {
                    "label": "Q3"
                },
                {
                    "label": "Q4"
                }
            ]
        }
    ],
    "dataset": [
        {
            "seriesname": "Last Year",
            "data": [
                {
                    "value": "10000"
                },
                {
                    "value": "11500"
                },
                {
                    "value": "12500"
                },
                {
                    "value": "15000"
                }
            ]
        },
        {
            "seriesname": "This Year",
            "data": [
                {
                    "value": "25400"
                },
                {
                    "value": "29800"
                },
                {
                    "value": "21800"
                },
                {
                    "value": "26800"
                }
            ]
        }
    ]
}

Drawing a custom legend icon shape

A multi-series column 2D chart with a custom legend icon shape looks as below:

FusionCharts will load here..

Given below are the attributes used to draw a custom legend icon shape:

Attribute Name Description

drawCustomLegendIcon

Sets whether drawing a custom legend icon will be enabled. Setting this attribute to 1 will enable the feature, setting it to 0 (default) will disable it. All legend icon customization attributes work only if this feature is enabled.

legendIconBorderColor

Sets the hex color code for the border of the legend icon. By default, it is assigned the data plot border color.

legendIconBgColor

Sets the hex color code for the background of the legend icon. By default, it is assigned the data plot fill color.

legendIconAlpha

Sets the legend icon transparency. This attribute takes values between 0 (transparent) and 100 (opaque; default).

legendIconBgAlpha

Sets the legend icon background transparency. This attribute takes values between 0 (transparent) and 100 (opaque; default).

legendIconSides

Sets the number of sides for the legend icon. The default value is 4.

legendIconBorderThickness

Sets the thickness of the legend icon border. The default value is 1.

legendIconStartAngle

Sets the starting angle for drawing the legend icon. The default value is 45.

{ "chart": { "caption": "Comparison of Quarterly Revenue", "subCaption": "FY2012-13 versus FY2013-14", "xAxisname": "Quarter", "yAxisName": "Revenue", "numberPrefix": "$", "theme": "fint", "legendBgAlpha": "0", "legendBorderAlpha": "0", "legendShadow": "0", "legendItemFontSize": "10", "legendItemFontColor": "#666666", "drawCustomLegendIcon": "1", "legendIconAlpha": "50", "legendIconBorderColor": "#123456", "legendIconBorderThickness": "3", "legendIconSides": "5", "legendIconStartAngle": "60" }, "categories": [ { "category": [ { "label": "Q1" }, { "label": "Q2" }, { "label": "Q3" }, { "label": "Q4" } ] } ], "dataset": [ { "seriesname": "FY2012-2013", "data": [ { "value": "10000" }, { "value": "11500" }, { "value": "12500" }, { "value": "15000" } ] }, { "seriesname": "FY2013-2014", "data": [ { "value": "25400" }, { "value": "29800" }, { "value": "21800" }, { "value": "26800" } ] } ] }
{
    "chart": {
        "caption": "Comparison of Quarterly Revenue",
        "subCaption": "FY2012-13 versus FY2013-14",
        "xAxisname": "Quarter",
        "yAxisName": "Revenue",
        "numberPrefix": "$",
        "theme": "fint",
        "legendBgAlpha": "0",
        "legendBorderAlpha": "0",
        "legendShadow": "0",
        "legendItemFontSize": "10",
        "legendItemFontColor": "#666666",
        "drawCustomLegendIcon": "1",
        "legendIconAlpha": "50",
        "legendIconBorderColor": "#123456",
        "legendIconBorderThickness": "3",
        "legendIconSides": "5",
        "legendIconStartAngle": "60"
    },
    "categories": [
        {
            "category": [
                {
                    "label": "Q1"
                },
                {
                    "label": "Q2"
                },
                {
                    "label": "Q3"
                },
                {
                    "label": "Q4"
                }
            ]
        }
    ],
    "dataset": [
        {
            "seriesname": "FY2012-2013",
            "data": [
                {
                    "value": "10000"
                },
                {
                    "value": "11500"
                },
                {
                    "value": "12500"
                },
                {
                    "value": "15000"
                }
            ]
        },
        {
            "seriesname": "FY2013-2014",
            "data": [
                {
                    "value": "25400"
                },
                {
                    "value": "29800"
                },
                {
                    "value": "21800"
                },
                {
                    "value": "26800"
                }
            ]
        }
    ]
}

Customizing legend scroll bar

If you have multiple data items in a multi-series chart, the legend automatically displays a scroll bar.

A multi-series column 2D chart with customized cosmetic properties of the legend scroll bar looks as below:

FusionCharts will load here..

The list of the attributes used to customize cosmetic properties of the legend scroll bar is mentioned below:

Attribute Name Description

legendScrollBgColor

Sets the background color of the scroll bar. Accepts hex code. e.g. #00ffaa.

The data structure needed to customize the cosmetic properties of the legend scroll bar is given below:

{ "chart": { "caption": "Letters Used in a Novel", "formatnumberscale": "0", "showBorder": "0", "showLegend": "1", "theme": "fint", "showPercentValues": "1", "showPercentInToolTip": "0", "legendPosition": "right", "legendCaption": "Alphabet Used: ", "legendScrollBgColor": "#cccccc", "legendScrollBarColor": "#999999" }, "data": [ { "label": "A", "value": "91852" }, { "label": "B", "value": "51852" }, { "label": "C", "value": "88168" }, { "label": "D", "value": "73897" }, { "label": "E", "value": "93933" }, { "label": "F", "value": "19289" }, { "label": "G", "value": "79623" }, { "label": "H", "value": "48262" }, { "label": "I", "value": "29162" }, { "label": "J", "value": "96878" }, { "label": "K", "value": "81241" }, { "label": "L", "value": "40652", "issliced": "1" }, { "label": "M", "value": "37581", "issliced": "1" }, { "label": "N", "value": "2882" }, { "label": "O", "value": "746" }, { "label": "P", "value": "7155" }, { "label": "Q", "value": "12072" }, { "label": "R", "value": "45608" }, { "label": "S", "value": "72570" }, { "label": "T", "value": "44799" }, { "label": "U", "value": "71887" }, { "label": "V", "value": "78170" }, { "label": "W", "value": "94345" }, { "label": "X", "value": "5434" }, { "label": "Y", "value": "34355" }, { "label": "Z", "value": "2323" } ] }
{
    "chart": {
        "caption": "Letters Used in a Novel",
        "formatnumberscale": "0",
        "showBorder": "0",
        "showLegend": "1",
        "theme": "fint",
        "showPercentValues": "1",
        "showPercentInToolTip": "0",
        "legendPosition": "right",
        "legendCaption": "Alphabet Used: ",
        "legendScrollBgColor": "#cccccc",
        "legendScrollBarColor": "#999999"
    },
    "data": [
        {
            "label": "A",
            "value": "91852"
        },
        {
            "label": "B",
            "value": "51852"
        },
        {
            "label": "C",
            "value": "88168"
        },
        {
            "label": "D",
            "value": "73897"
        },
        {
            "label": "E",
            "value": "93933"
        },
        {
            "label": "F",
            "value": "19289"
        },
        {
            "label": "G",
            "value": "79623"
        },
        {
            "label": "H",
            "value": "48262"
        },
        {
            "label": "I",
            "value": "29162"
        },
        {
            "label": "J",
            "value": "96878"
        },
        {
            "label": "K",
            "value": "81241"
        },
        {
            "label": "L",
            "value": "40652",
            "issliced": "1"
        },
        {
            "label": "M",
            "value": "37581",
            "issliced": "1"
        },
        {
            "label": "N",
            "value": "2882"
        },
        {
            "label": "O",
            "value": "746"
        },
        {
            "label": "P",
            "value": "7155"
        },
        {
            "label": "Q",
            "value": "12072"
        },
        {
            "label": "R",
            "value": "45608"
        },
        {
            "label": "S",
            "value": "72570"
        },
        {
            "label": "T",
            "value": "44799"
        },
        {
            "label": "U",
            "value": "71887"
        },
        {
            "label": "V",
            "value": "78170"
        },
        {
            "label": "W",
            "value": "94345"
        },
        {
            "label": "X",
            "value": "5434"
        },
        {
            "label": "Y",
            "value": "34355"
        },
        {
            "label": "Z",
            "value": "2323"
        }
    ]
}

Reversing legend order

A multi-series column 2D chart with the order of legend items reversed looks as below:

FusionCharts will load here..

The attribute to reverse legend order is mentioned below:

Attribute Name Description

reverseLegend

You can reverse the ordering of datasets in the legend by setting this attribute to 1. This is set to 0 by default.

The data structure needed to reverse the order of legend items is given below:

{ "chart": { "caption": "Comparison of Quarterly Revenue", "subCaption": "Last year Vs This year", "xAxisname": "Quarter", "yAxisName": "Revenue (In USD)", "numberPrefix": "$", "theme": "fint", "legendBgColor": "#CCCCCC", "legendBgAlpha": "20", "legendBorderColor": "#666666", "legendBorderThickness": "1", "legendBorderAlpha": "40", "legendShadow": "1", "reverseLegend": "1" }, "categories": [ { "category": [ { "label": "Q1" }, { "label": "Q2" }, { "label": "Q3" }, { "label": "Q4" } ] } ], "dataset": [ { "seriesname": "Last Year", "data": [ { "value": "10000" }, { "value": "11500" }, { "value": "12500" }, { "value": "15000" } ] }, { "seriesname": "This Year", "data": [ { "value": "25400" }, { "value": "29800" }, { "value": "21800" }, { "value": "26800" } ] } ] }
{
    "chart": {
        "caption": "Comparison of Quarterly Revenue",
        "subCaption": "Last year Vs This year",
        "xAxisname": "Quarter",
        "yAxisName": "Revenue (In USD)",
        "numberPrefix": "$",
        "theme": "fint",
        "legendBgColor": "#CCCCCC",
        "legendBgAlpha": "20",
        "legendBorderColor": "#666666",
        "legendBorderThickness": "1",
        "legendBorderAlpha": "40",
        "legendShadow": "1",
        "reverseLegend": "1"
    },
    "categories": [
        {
            "category": [
                {
                    "label": "Q1"
                },
                {
                    "label": "Q2"
                },
                {
                    "label": "Q3"
                },
                {
                    "label": "Q4"
                }
            ]
        }
    ],
    "dataset": [
        {
            "seriesname": "Last Year",
            "data": [
                {
                    "value": "10000"
                },
                {
                    "value": "11500"
                },
                {
                    "value": "12500"
                },
                {
                    "value": "15000"
                }
            ]
        },
        {
            "seriesname": "This Year",
            "data": [
                {
                    "value": "25400"
                },
                {
                    "value": "29800"
                },
                {
                    "value": "21800"
                },
                {
                    "value": "26800"
                }
            ]
        }
    ]
}

Hiding legend

A multi-series column 2D chart with legend hidden looks as below:

FusionCharts will load here..

The attribute to show or hide a legend is mentioned in the table below:

Attribute Name Description

showLegend

Whether to show legend on the chart. Set it to 1 to show the legend or to 0 to hide it.

The data structure needed to hide a legend is given below:

{ "chart": { "caption": "Comparison of Quarterly Revenue", "subCaption": "Last year Vs This year", "xAxisname": "Quarter", "yAxisName": "Amount (In USD)", "numberPrefix": "$", "theme": "fint", "showLegend": "0" }, "categories": [ { "category": [ { "label": "Q1" }, { "label": "Q2" }, { "label": "Q3" }, { "label": "Q4" } ] } ], "dataset": [ { "seriesname": "Last Year", "data": [ { "value": "10000" }, { "value": "11500" }, { "value": "12500" }, { "value": "15000" } ] }, { "seriesname": "This Year", "data": [ { "value": "25400" }, { "value": "29800" }, { "value": "21800" }, { "value": "26800" } ] } ] }
{
    "chart": {
        "caption": "Comparison of Quarterly Revenue",
        "subCaption": "Last year Vs This year",
        "xAxisname": "Quarter",
        "yAxisName": "Amount (In USD)",
        "numberPrefix": "$",
        "theme": "fint",
        "showLegend": "0"
    },
    "categories": [
        {
            "category": [
                {
                    "label": "Q1"
                },
                {
                    "label": "Q2"
                },
                {
                    "label": "Q3"
                },
                {
                    "label": "Q4"
                }
            ]
        }
    ],
    "dataset": [
        {
            "seriesname": "Last Year",
            "data": [
                {
                    "value": "10000"
                },
                {
                    "value": "11500"
                },
                {
                    "value": "12500"
                },
                {
                    "value": "15000"
                }
            ]
        },
        {
            "seriesname": "This Year",
            "data": [
                {
                    "value": "25400"
                },
                {
                    "value": "29800"
                },
                {
                    "value": "21800"
                },
                {
                    "value": "26800"
                }
            ]
        }
    ]
}

Hiding series upon loading

A multi-series column 2D chart with one data series hidden looks as below:

FusionCharts will load here..

Given below is the attribute used to initially hide a dataset on chart loading:

Attribute Name Description

initiallyHidden

Works from the dataset object level in JSON data. Set it to 1 to hide the plots of a series initially, on chart load. Default value is 0 for all series and they show up initially.

The data structure needed to hide a series is given below:

{ "chart": { "caption": "Comparison of Quarterly Revenue", "subCaption": "Last year Vs This year", "xAxisname": "Quarter", "yAxisName": "Revenue (In USD)", "numberPrefix": "$", "theme": "fint", "legendBgColor": "#CCCCCC", "legendBgAlpha": "20", "legendBorderColor": "#666666", "legendBorderThickness": "1", "legendBorderAlpha": "40", "legendShadow": "1" }, "categories": [ { "category": [ { "label": "Q1" }, { "label": "Q2" }, { "label": "Q3" }, { "label": "Q4" } ] } ], "dataset": [ { "seriesname": "Last Year", "initiallyHidden": "1", "data": [ { "value": "10000" }, { "value": "11500" }, { "value": "12500" }, { "value": "15000" } ] }, { "seriesname": "This Year", "data": [ { "value": "25400" }, { "value": "29800" }, { "value": "21800" }, { "value": "26800" } ] } ] }
{
    "chart": {
        "caption": "Comparison of Quarterly Revenue",
        "subCaption": "Last year Vs This year",
        "xAxisname": "Quarter",
        "yAxisName": "Revenue (In USD)",
        "numberPrefix": "$",
        "theme": "fint",
        "legendBgColor": "#CCCCCC",
        "legendBgAlpha": "20",
        "legendBorderColor": "#666666",
        "legendBorderThickness": "1",
        "legendBorderAlpha": "40",
        "legendShadow": "1"
    },
    "categories": [
        {
            "category": [
                {
                    "label": "Q1"
                },
                {
                    "label": "Q2"
                },
                {
                    "label": "Q3"
                },
                {
                    "label": "Q4"
                }
            ]
        }
    ],
    "dataset": [
        {
            "seriesname": "Last Year",
            "initiallyHidden": "1",
            "data": [
                {
                    "value": "10000"
                },
                {
                    "value": "11500"
                },
                {
                    "value": "12500"
                },
                {
                    "value": "15000"
                }
            ]
        },
        {
            "seriesname": "This Year",
            "data": [
                {
                    "value": "25400"
                },
                {
                    "value": "29800"
                },
                {
                    "value": "21800"
                },
                {
                    "value": "26800"
                }
            ]
        }
    ]
}

Customizing legend appearance

A multi-series column 2D chart legend with customized appearance looks as below:

FusionCharts will load here..

Given below is the list of attributes used to customize the legend appearance:

Attribute Name Description

legendBgColor

Background color for the legend. Accepts hex code. e.g. #00ffaa.

legendBgAlpha

Background alpha for the legend. It can take values from 0 (transparent) to 100 (opaque).

legendBorderColor

Border Color for the legend. Accepts hex code. e.g. #00ffaa.

legendBorderThickness

Border thickness for the legend (in pixels).

legendBorderAlpha

Border alpha for the legend. It can take values from 0(transparent) to 100 (opaque).

legendShadow

Whether to show a shadow for legend. Set it to 1 to show shadow and 0 to hide it.

legendScrollBgColor

If you’ve too many items on the legend, a scroll bar shows up on the same. This attribute lets you configure the background color of the scroll bar. Accepts hex code. e.g. #00ffaa.

legendCaptionAlignment

Sets the legend caption horizontal alignment with valid values of left, center and right.

The data structure needed to customize the legend appearance is given below:

{ "chart": { "caption": "Comparison of Quarterly Revenue", "subCaption": "Last year Vs This year", "xAxisname": "Quarter", "yAxisName": "Revenue (In USD)", "numberPrefix": "$", "theme": "fint", "legendBgColor": "#CCCCCC", "legendBgAlpha": "20", "legendBorderColor": "#666666", "legendBorderThickness": "1", "legendBorderAlpha": "40", "legendShadow": "1" }, "categories": [ { "category": [ { "label": "Q1" }, { "label": "Q2" }, { "label": "Q3" }, { "label": "Q4" } ] } ], "dataset": [ { "seriesname": "Last Year", "data": [ { "value": "10000" }, { "value": "11500" }, { "value": "12500" }, { "value": "15000" } ] }, { "seriesname": "This Year", "data": [ { "value": "25400" }, { "value": "29800" }, { "value": "21800" }, { "value": "26800" } ] } ] }
{
    "chart": {
        "caption": "Comparison of Quarterly Revenue",
        "subCaption": "Last year Vs This year",
        "xAxisname": "Quarter",
        "yAxisName": "Revenue (In USD)",
        "numberPrefix": "$",
        "theme": "fint",
        "legendBgColor": "#CCCCCC",
        "legendBgAlpha": "20",
        "legendBorderColor": "#666666",
        "legendBorderThickness": "1",
        "legendBorderAlpha": "40",
        "legendShadow": "1"
    },
    "categories": [
        {
            "category": [
                {
                    "label": "Q1"
                },
                {
                    "label": "Q2"
                },
                {
                    "label": "Q3"
                },
                {
                    "label": "Q4"
                }
            ]
        }
    ],
    "dataset": [
        {
            "seriesname": "Last Year",
            "data": [
                {
                    "value": "10000"
                },
                {
                    "value": "11500"
                },
                {
                    "value": "12500"
                },
                {
                    "value": "15000"
                }
            ]
        },
        {
            "seriesname": "This Year",
            "data": [
                {
                    "value": "25400"
                },
                {
                    "value": "29800"
                },
                {
                    "value": "21800"
                },
                {
                    "value": "26800"
                }
            ]
        }
    ]
}

Customizing legend font cosmetics

A multi-series column 2D chart legend with customized font cosmetics looks as below:

FusionCharts will load here..

Given below is the list of attributes used to customize the legend font cosmetics:

Attribute Name Description

legendItemFont

Sets legend item font, e.g. Arial

legendItemFontSize

Sets legend item font size, with values ranging from 0 to 72

legendItemFontColor

Sets legend item font color in hex code, e.g. #00ffaa

legendItemFontBold

Whether legend keys should be displayed in bold. Set 1 to make it bold or 0 to keep it normal.

legendItemHoverFontColor

Sets legend item font color on hover in hex code, e.g. #00ffaa

legendCaptionFont

Sets legend caption font, e.g. Arial

legendCaptionFontSize

Sets legend caption font size, with values ranging from 0 to 72

legendCaptionBold

Whether legend caption should be displayed in bold. Set 1 to make it bold or 0 to keep it normal.

The data structure needed to customized legend font cosmetics is given below:

{ "chart": { "caption": "Comparison of Quarterly Revenue", "subCaption": "Last year Vs This year", "xAxisname": "Quarter", "yAxisName": "Amount (In USD)", "numberPrefix": "$", "theme": "fint", "legendPosition": "right", "legendCaption": "Which year?", "legendCaptionBold": "1", "legendCaptionFont": "Arial", "legendCaptionFontSize": "14", "legendCaptionFontColor": "#333333", "legendItemFontBold": "0", "legendItemFont": "Arial", "legendItemFontSize": "11", "legendItemFontColor": "#666666", "legendItemHoverFontColor": "#000000", "legendCaptionAlignment": "left", "legendItemHiddenColor": "#e8e8e8" }, "categories": [ { "category": [ { "label": "Q1" }, { "label": "Q2" }, { "label": "Q3" }, { "label": "Q4" } ] } ], "dataset": [ { "seriesname": "Last Year", "data": [ { "value": "10000" }, { "value": "11500" }, { "value": "12500" }, { "value": "15000" } ] }, { "seriesname": "This Year", "data": [ { "value": "25400" }, { "value": "29800" }, { "value": "21800" }, { "value": "26800" } ] } ] }
{
    "chart": {
        "caption": "Comparison of Quarterly Revenue",
        "subCaption": "Last year Vs This year",
        "xAxisname": "Quarter",
        "yAxisName": "Amount (In USD)",
        "numberPrefix": "$",
        "theme": "fint",
        "legendPosition": "right",
        "legendCaption": "Which year?",
        "legendCaptionBold": "1",
        "legendCaptionFont": "Arial",
        "legendCaptionFontSize": "14",
        "legendCaptionFontColor": "#333333",
        "legendItemFontBold": "0",
        "legendItemFont": "Arial",
        "legendItemFontSize": "11",
        "legendItemFontColor": "#666666",
        "legendItemHoverFontColor": "#000000",
        "legendCaptionAlignment": "left",
        "legendItemHiddenColor": "#e8e8e8"
    },
    "categories": [
        {
            "category": [
                {
                    "label": "Q1"
                },
                {
                    "label": "Q2"
                },
                {
                    "label": "Q3"
                },
                {
                    "label": "Q4"
                }
            ]
        }
    ],
    "dataset": [
        {
            "seriesname": "Last Year",
            "data": [
                {
                    "value": "10000"
                },
                {
                    "value": "11500"
                },
                {
                    "value": "12500"
                },
                {
                    "value": "15000"
                }
            ]
        },
        {
            "seriesname": "This Year",
            "data": [
                {
                    "value": "25400"
                },
                {
                    "value": "29800"
                },
                {
                    "value": "21800"
                },
                {
                    "value": "26800"
                }
            ]
        }
    ]
}
Top