Create a Chart Using FusionCharts
FusionCharts Suite XT — the industry's most comprehensive JavaScript charting solution — is all about easing the whole process of data visualization through charts.
On this page, we'll see how to install FusionCharts library and all the other dependencies on your system and render a chart using Plain JavaScript.
Prerequisite
In case of including Fusioncharts dependencies from CDN or Local Files, you can skip this step and get started with the code mentioned in the below steps.
If you choose to install fusioncharts package via npm, make sure you have Node.js installed in your system. Make sure you have a bundler like webpack and parcel or have browserify installed in your system.
Installation and including dependencies
You can install the fusioncharts components by following any of the methods below:
- Include the FusionCharts JavaScript files from CDN in your static HTML file.
- Include the theme file.
<head>
<!-- Step 1 - Include the fusioncharts core library -->
<script type="text/javascript" src="https://cdn.fusioncharts.com/fusioncharts/latest/fusioncharts.js"></script>
<!-- Step 2 - Include the fusion theme -->
<script type="text/javascript" src="https://cdn.fusioncharts.com/fusioncharts/latest/themes/fusioncharts.theme.fusion.js"></script>
</head>
- Include the FusionCharts JavaScript files, which can be downloaded from here.
- Include the FusionCharts theme file to apply style to the charts.
<head>
<!-- Step 1 - Include the fusioncharts core library -->
<script type="text/javascript" src="path/to/local/fusioncharts.js"></script>
<!-- Step 2 - Include the fusion theme -->
<script type="text/javascript" src="path/to/local/themes/fusioncharts.theme.fusion.js"></script>
</head>
$ mkdir projectName
$ cd projectName
$ npm install webpack webpack-cli --save-dev
fusioncharts package via npm run the command below:
$ npm install fusioncharts
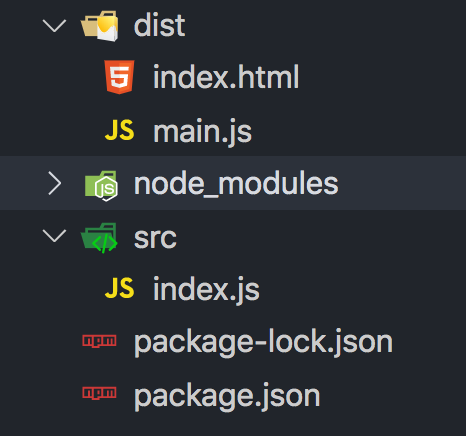
- Create an
srcfolder inside project directory. Within the src folder, create anindex.jsfile. - Create a
distfolder inside the project directory. Within the dist folder, create anindex.htmlfile.
index.js file with the code shown in the steps below to create your first chart. Import all the required dependencies to get started.
// Include the core fusioncharts file from core
import FusionCharts from 'fusioncharts/core';
// Include the chart from viz folder
import Column2D from 'fusioncharts/viz/column2d';
// Include the fusion theme
import FusionTheme from 'fusioncharts/themes/es/fusioncharts.theme.fusion';
// Add the chart and theme as dependency
// E.g. FusionCharts.addDep(ChartType)
FusionCharts.addDep(Column2D);
FusionCharts.addDep(FusionTheme);
That completes the installation of FusionCharts Suite.
Preparing the data
Let's create a chart showing the "Countries With Most Oil Reserves". The data of the oil reserves present in various countries is shown in tabular form below.
| Country | No. of Oil Reserves |
|---|---|
| Venezuela | 290K |
| Saudi | 260K |
| Canada | 180K |
| Iran | 140K |
| Russia | 115K |
| UAE | 100K |
| US | 30K |
| China | 30K |
Since we are plotting a single dataset, let us create a column 2D chart with 'countries' as data labels along the x-axis and 'No. of oil reserves' as data values along y-axis. Let us prepare the data for a single-series chart.
FusionCharts accepts the data in JSON format. So the above data in the tabular form will take the below shape.
// Preparing the chart data
const chartData = [
{
label: "Venezuela",
value: "290"
},
{
label: "Saudi",
value: "260"
},
{
label: "Canada",
value: "180"
},
{
label: "Iran",
value: "140"
},
{
label: "Russia",
value: "115"
},
{
label: "UAE",
value: "100"
},
{
label: "US",
value: "30"
},
{
label: "China",
value: "30"
}
];Configure your chart
Now that the data is ready, let's work on the styling, positioning and giving your chart a context.
// Create a JSON object to store the chart configurations
const chartConfigs = {
//Specify the chart type
type: "column2d",
//Set the container object
renderAt: "chart-container",
//Specify the width of the chart
width: "100%",
//Specify the height of the chart
height: "400",
//Set the type of data
dataFormat: "json",
dataSource: {
chart: {
//Set the chart caption
caption: "Countries With Most Oil Reserves [2017-18]",
//Set the chart subcaption
subCaption: "In MMbbl = One Million barrels",
//Set the x-axis name
xAxisName: "Country",
//Set the y-axis name
yAxisName: "Reserves (MMbbl)",
numberSuffix: "K",
//Set the theme for your chart
theme: "fusion"
},
// Chart Data from Step 2
data: chartData
}
};Find the complete list of chart types with their respective alias here.
Render the chart
The consolidated code to render the chart is shown below:
fusioncharts package for npm can be used in two different ways:- FusionCharts ES module
- FusionCharts CJS module
index.js include the necessary files and import the fusioncharts dependency. The consolidated code is shown below:ES6
// Include the core fusioncharts file from core -
import FusionCharts from 'fusioncharts/core';
// Include the chart from viz folder
// E.g. - import ChartType from fusioncharts/viz/[ChartType]
import Column2D from 'fusioncharts/viz/column2d';
// Include the fusion theme
import FusionTheme from 'fusioncharts/themes/es/fusioncharts.theme.fusion';
// Add the chart and theme as dependency
// E.g. FusionCharts.addDep(ChartType)
FusionCharts.addDep(Column2D);
FusionCharts.addDep(FusionTheme);
//STEP 2 - Chart Data
const chartData = [{
"label": "Venezuela",
"value": "290"
}, {
"label": "Saudi",
"value": "260"
}, {
"label": "Canada",
"value": "180"
}, {
"label": "Iran",
"value": "140"
}, {
"label": "Russia",
"value": "115"
}, {
"label": "UAE",
"value": "100"
}, {
"label": "US",
"value": "30"
}, {
"label": "China",
"value": "30"
}];
//STEP 3 - Chart Configurations
const chartConfig = {
type: 'column2d',
renderAt: 'chart-container',
width: '100%',
height: '400',
dataFormat: 'json',
dataSource: {
// Chart Configuration
"chart": {
"caption": "Countries With Most Oil Reserves [2017-18]",
"subCaption": "In MMbbl = One Million barrels",
"xAxisName": "Country",
"yAxisName": "Reserves (MMbbl)",
"numberSuffix": "K",
"theme": "fusion",
},
// Chart Data
"data": chartData
}
};
// STEP 4 - Create an Instance with chart options and render the chart
var chartInstance = new FusionCharts(chartConfig);
chartInstance.render();
CJS
var FusionCharts = require('fusioncharts');
// Require charts from fusioncharts
var Charts = require('fusioncharts/fusioncharts.charts');
// Require theme from fusioncharts
var FusionTheme = require('fusioncharts/themes/fusioncharts.theme.fusion');
// Add charts and themes as dependency
Charts(FusionCharts);
FusionTheme(FusionCharts);
//STEP 2 - Chart Data
const chartData = [{
"label": "Venezuela",
"value": "290"
}, {
"label": "Saudi",
"value": "260"
}, {
"label": "Canada",
"value": "180"
}, {
"label": "Iran",
"value": "140"
}, {
"label": "Russia",
"value": "115"
}, {
"label": "UAE",
"value": "100"
}, {
"label": "US",
"value": "30"
}, {
"label": "China",
"value": "30"
}];
//STEP 3 - Chart Configurations
const chartConfig = {
type: 'column2d',
renderAt: 'chart-container',
width: '100%',
height: '400',
dataFormat: 'json',
dataSource: {
// Chart Configuration
"chart": {
"caption": "Countries With Most Oil Reserves [2017-18]",
"subCaption": "In MMbbl = One Million barrels",
"xAxisName": "Country",
"yAxisName": "Reserves (MMbbl)",
"numberSuffix": "K",
"theme": "fusion",
},
// Chart Data
"data": chartData
}
};
// STEP 4 - Create an Instance with chart options and render
var chartInstance = new FusionCharts(chartConfig);
chartInstance.render();
index.html file.
<!doctype html>
<html>
<head>
<title>Getting Started</title>
</head>
<body>
<div id="chart-container">Fusioncharts will render here</div>
<script src="index.js"></script>
</body>
</html>
npx webpack command in the terminal. Once the build is successful, open the index.html file to see your chart.
<html>
<head>
<title>My first chart using FusionCharts Suite XT</title>
<!-- Include fusioncharts core library -->
<script type="text/javascript" src="https://cdn.fusioncharts.com/fusioncharts/latest/fusioncharts.js"></script>
<!-- Include fusion theme -->
<script type="text/javascript" src="https://cdn.fusioncharts.com/fusioncharts/latest/themes/fusioncharts.theme.fusion.js"></script>
<script type="text/javascript">
//STEP 2 - Chart Data
const chartData = [{
"label": "Venezuela",
"value": "290"
}, {
"label": "Saudi",
"value": "260"
}, {
"label": "Canada",
"value": "180"
}, {
"label": "Iran",
"value": "140"
}, {
"label": "Russia",
"value": "115"
}, {
"label": "UAE",
"value": "100"
}, {
"label": "US",
"value": "30"
}, {
"label": "China",
"value": "30"
}];
//STEP 3 - Chart Configurations
const chartConfig = {
type: 'column2d',
renderAt: 'chart-container',
width: '100%',
height: '400',
dataFormat: 'json',
dataSource: {
// Chart Configuration
"chart": {
"caption": "Countries With Most Oil Reserves [2017-18]",
"subCaption": "In MMbbl = One Million barrels",
"xAxisName": "Country",
"yAxisName": "Reserves (MMbbl)",
"numberSuffix": "K",
"theme": "fusion",
},
// Chart Data
"data": chartData
}
};
FusionCharts.ready(function(){
var fusioncharts = new FusionCharts(chartConfig);
fusioncharts.render();
});
</script>
</head>
<body>
<div id="chart-container">FusionCharts XT will load here!</div>
</body>
</html>
<html>
<head>
<title>My first chart using FusionCharts Suite XT</title>
<!-- Include fusioncharts core library -->
<script type="text/javascript" src="path/to/local/fusioncharts.js"></script>
<!-- Include fusion theme -->
<script type="text/javascript" src="path/to/local/themes/fusioncharts.theme.fusion.js"></script>
<script type="text/javascript">
//STEP 2 - Chart Data
const chartData = [{
"label": "Venezuela",
"value": "290"
}, {
"label": "Saudi",
"value": "260"
}, {
"label": "Canada",
"value": "180"
}, {
"label": "Iran",
"value": "140"
}, {
"label": "Russia",
"value": "115"
}, {
"label": "UAE",
"value": "100"
}, {
"label": "US",
"value": "30"
}, {
"label": "China",
"value": "30"
}];
// STEP 3 - Chart Configurations
const chartConfig = {
type: 'column2d',
renderAt: 'chart-container',
width: '100%',
height: '400',
dataFormat: 'json',
dataSource: {
// Chart Configuration
"chart": {
"caption": "Countries With Most Oil Reserves [2017-18]",
"subCaption": "In MMbbl = One Million barrels",
"xAxisName": "Country",
"yAxisName": "Reserves (MMbbl)",
"numberSuffix": "K",
"theme": "fusion",
},
// Chart Data
"data": chartData
}
};
FusionCharts.ready(function(){
var fusioncharts = new FusionCharts(chartConfig);
fusioncharts.render();
});
</script>
</head>
<body>
<div id="chart-container">FusionCharts XT will load here!</div>
</body>
</html>
See your chart
You should be able to see the chart as shown below.
If you are getting a JavaScript error on your page, check your browser console for the exact error and fix it accordingly. If you're unable to solve it, click here to get in touch with our support team.
That's it! Your first chart using Plain JavaScript is ready.