Changed Behavior
This section is for users who are using previous version of FusionCharts in their application. Here we'll talk about the change in behavior of the charts after v3.16.x.
Configuring legend icons opacity
You can now set the values of legendIconAlpha and legendIconBgAlpha attributes to inherit to inherit the alpha value from the data plot attributes. The default value for legendIconAlpha and legendIconBgAlpha is now set to inherit and they can now work at both global and local level. Previously, legendIconAlpha and legendIconBgAlpha had a default value of 100% and could only be used at global level.
Configuring anchors and their opacity
You can set the values of anchorBorderColor and anchorBgColor attributes to inherit so they use the palette color value from data plots. anchorAlpha, anchorBgAlpha, and anchorImageAlpha can use the value inherit to use the the alpha value from data plots defined via plotFillAlpha or alpha. Previously, using a theme or palette color in charts with line/area plot and anchors only affected anchorBorderColor anchor background was null/transparent.
Support for HTML tags across all chart text elements
FusionCharts now uses the standard way for defining all existing and new inline HTML tags. Example: <br>. Previously, FusionCharts used the {br} template style to define inline HTML tags which is now deprecated.
Returning column data values when exporting SparkWinLoss charts
Exporting SparkWinLoss charts as a CSV or Excel file now displays the win, loss and draw column values correctly. Previously, when exporting a SparkWinLoss chart to CVS or Excel, the output was inconsistent.
TreeMap charts render all data plots with specified colors
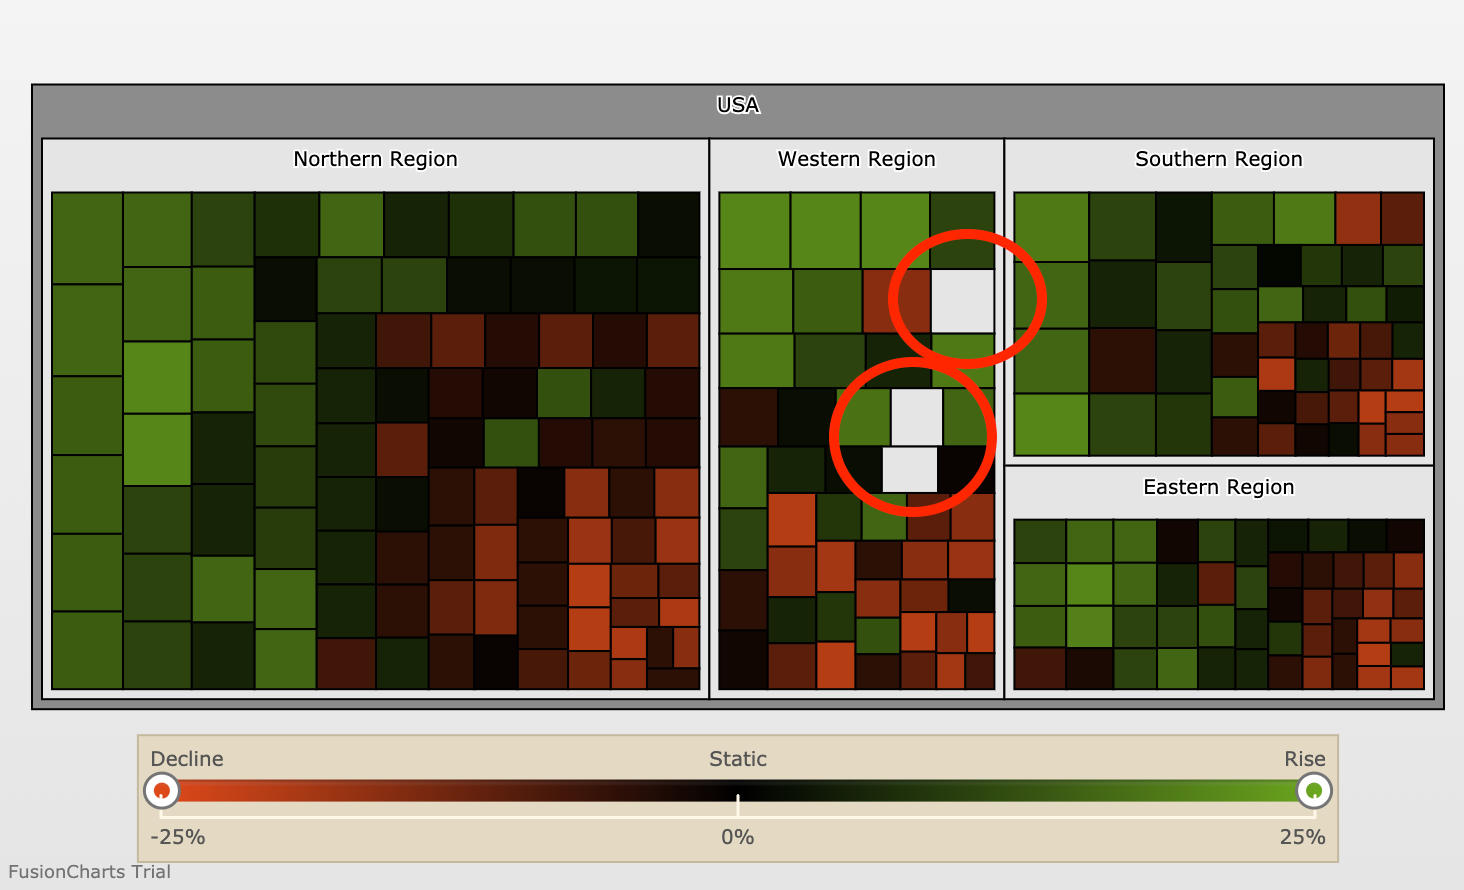
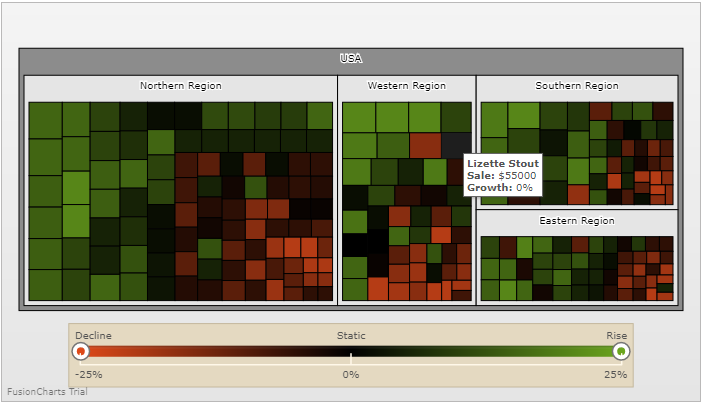
Treemap charts are now improved to handle situations when the secondary value is 0. Previously, if secondary value was 0 the data plots were not colored properly and appeared as white on the chart.
Before the fix Earlier, if the secondary value was 0 the data plot was not colored properly and appeared as white.

After the fix Treemap charts now render all data plots with their specified color.
Multi-series Column charts display all column bars correctly
The Multi-series Column chart now displays all small values column bars correctly. Previously zero values had a fix height of 1px while values higher than zero were not visible.
Before the fix Earlier, 0 values had a fix height of 1px while small values higher then 0 were not visible for scenario when the value difference is huge.

After the fix The Multi-series Column chart now displays all small value column bars with a fixed height of 1px and all 0 values are now displayed correctly.
