Tooltips
A tooltip is displayed when the mouse cursor hovers over a particular data point. It denotes valuable information such as:
Name and data value in single series charts.
Name and value/percentage in pie and doughnut charts.
A series name, category name, and data value for multi-series and combination charts.
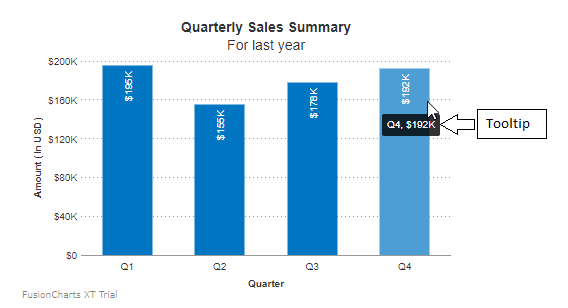
Show/Hide Tooltips
By default, the tooltip is displayed. To hide the tool tip set the showToolTip attribute to 0.
Refer to the code below:
{
"chart": {
"showToolTip": "0"
}
}Customize Tooltips
To customize the tooltip use the following attributes:
Specify the hex code for the tooltip background color using the
toolTipBGColorattribute. Example - #efefef.Specify the hex code for the tooltip border color using the
toolTipBorderColorattribute. Example - #666666.By default, the character used to separate the name and the value within the tooltip is set as
,. Set a different separator character using theToolTipSepCharattribute. This attribute accepts any string, e.g.:.Set the
showTooltipShadowattribute to1to display shadow.
Refer to the code below:
{
"chart": {
"toolTipBorderColor": "#666666",
"toolTipBgColor": "#efefef",
"toolTipBgAlpha": "80",
"showToolTipShadow": "1"
}
}The chart will look as shown below:
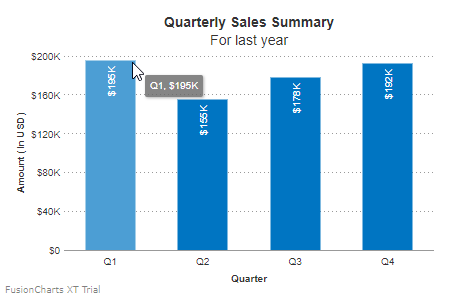
Click here to edit the above chart.
Display Multiline Tooltip Text
By default, a tooltip shows the data item name and value in a single line of text. However, if you want to display more information on the tooltip, you can use the attribute tooltext to show the text in multiline format.
Refer to the code below:
{
"chart": {},
"data": [
{
"tooltext": "Quarter 1{br}Total Sale: $195K{br}Rank: 1"
}
]
}The chart will look as shown below:
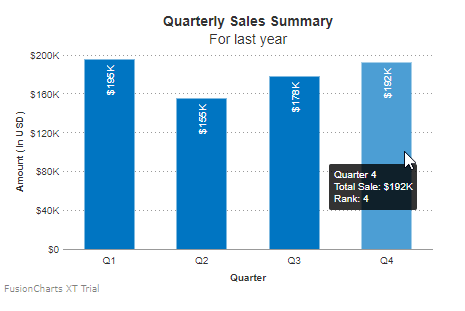
Click here to edit the above chart.
Introduction to Macros
FusionCharts Suite XT 3.4 introduces macros to configure dynamic and contextual content in tooltips. A macro is an instruction recorded using a combination of characters for a specific purpose.
You can use tooltip macros to customize chart labels, data values, display values, etc. as variables, and plain text, to form a completely customized tooltip text. Each chart contains labels, raw values, formatted values, display values, etc., as variables that you use in conjunction with your custom text to form the complete tooltext.
Tooltips can be configured to include supplementary information about the data plotted on a chart. Macros allow you to automate the inclusion of this information, saving the effort of manual customization.
Keep the following pointers in mind when using macros:
Macros are case-insensitive.
A macro which is not applicable will be treated as string.
To use a macro name as text in tooltip use
""before the"$"sign. Example: to show "$value" in tooltip use "$value" intooltextattribute.Tooltext can also be configured from corresponding parent nodes (that is, chart, dataset, etc.).
How to use Tooltip Macros
To configure tooltip text with tooltip macros, set a custom tooltip using plotToolText attribute. The attribute accepts macros, plain text, and HTML tags, as strings to create custom tooltip text for data plots. You can use the following attributes with plotToolText:
Use the
$labelmacro to customize the data plot, category, connector, and marker labels.Use the
$dataValuemacro to customize the formatted data plot, entity, and marker data values. Alternatively, you can also use the$valuemacro, to customize the unformatted data value.Use the
$displayValuemacro to customize the value of thedisplayValueattribute of thedataandentityobjects.
Refer to the code below:
{
"chart": {
"plotToolText": "Store location: $label <br> Sales (YTD): $dataValue <br> $displayValue"
}
}The chart will look like as shown below:
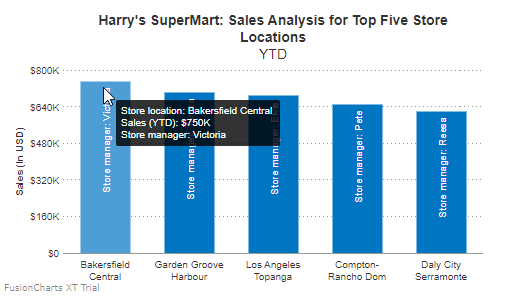
Click here to edit the above chart.
In the chart above, if the data plot value is 750000 and you use
$value,750000will be rendered as the value. However, if you use$dataValue, then$750Kwill be rendered as the value.
Other Attributes
The following are some of the FusionCharts attributes that take tooltip macros as values. You can use these to customize tooltip text for the various chart elements.
Specify the tooltip text using the
trendLineToolTextattribute under thechartobject. It accepts macros, plain text, and HTML tags, as strings.Customize tooltip text for all/individual data plots in a Pareto Chart using the
cumulativePlotTooltextattribute under thechartand thedataobject. It accepts macros, plain text, and HTML tags, as strings.Customize tooltip text for the target in the horizontal and vertical bullet graphs using the
targetToolTextattribute under thechartobject. It accepts macros, plain text, and HTML tags, as strings.Customize tooltip text for the milestones in Gantt charts using the
milestoneToolTextattribute under thechartobject. It accepts macros, plain text, and HTML tags, as strings.Customize tooltip text for the data plots in error charts using the
errorPlotToolTextattribute under thedatasetanddataobjects. It accepts macros, plain text, and HTML tags, as strings.Customize tooltip text for the horizontal error bars in error scatter charts. The attribute
horizontalErrorPlotToolTextattribute under thedatasetanddataobjects. It accepts macros, plain text, and HTML tags, as strings.Customize tooltip text for the vertical error bars in error scatter charts using the
verticalErrorPlotToolTextattribute under thedatasetanddataobjects. It accepts macros, plain text, and HTML tags, as strings.Customize tooltip text for the entities in maps using the
entityToolTextattribute under themap(or thechart) object. It accepts macros, plain text, and HTML tags, as strings.Customize tooltip text for the markers in maps using the
markerToolTextattribute under themap(or thechart) object. It accepts macros, plain text, and HTML tags, as strings.Customize tooltip text for the connectors in maps and the drag-node chart using the
connectorToolTextattribute under themap(or thechart) object (for maps) and theconnectorsobject (for the drag-node chart). It accepts macros, plain text, and HTML tags, as strings.Customize tooltip text for the outliers in the Box and Whisker chart using the
outliersTooltextattribute under thedatasetanddataobjects. It accepts macros, plain text, and HTML tags, as strings.Customize tooltip text for the mean icon in the Box and Whisker chart using the
meanTooltextattribute under thedatasetanddataobjects. It accepts macros, plain text, and HTML tags, as strings.Customize tooltip text for the standard deviation icon in the Box and Whisker chart using the
SDTooltextattribute under thedatasetanddataobjects. It accepts macros, plain text, and HTML tags, as strings.Customize tooltip text for the quartile deviation icon in the Box and Whisker chart using the
QDTooltextattribute under thedatasetanddataobjects. It accepts macros, plain text, and HTML tags, as strings.Customize tooltip text for the mean deviation icon in the Box and Whisker charts using the
MDTooltextattribute under thedatasetanddataobjects. It accepts macros, plain text, and HTML tags, as strings.
Tooltip Macros: Additional Examples
FusionCharts Suite XT includes about a 100 macros that you can use to customize the text and the formatting of tooltips.
Example 1: Tooltip Macros for Trend Lines
By default, trend lines don't have a tooltip text configured for them. However, you can use tooltip macros to set a custom tooltip text.
Refer to the code below:
{
"chart": {
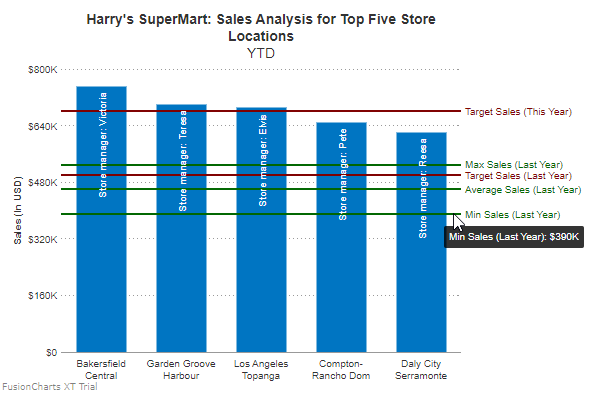
"trendlineToolText": "$displayValue: $startDataValue"
}
}The chart will look like as shown below:
Click here to edit the above chart.
In the above chart, hover the mouse pointer over the trend-lines to see the tooltip text. You can find the description of the trendlineToolText attribute, in the Other attributes you can use section.
Apart from the ones given above, you can use either the $startDataValue macro (which represents the formatted starting value of a trend-line/trend-zone) or the $startValue macro (which represents the unformatted starting value). If the starting value is 680000 and you use $startDataValue, then the chart will show \$680k as the data value. On the other hand, if you use $startValue, then the chart will show 680000 as the data value.
Click here for the complete list of tooltip macros supported by FusionCharts Suite XT.
Example 2: Tooltip Macros for Map Connectors
Use the following attribute and tooltip macros to set a tooltip text for connectors in maps:
Specify tooltip text for the connectors in maps and the drag-node chart using the
connectorToolTextattribute. It accepts macros, plain text and HTML tags, as strings.Specify the label of the source marker (for maps)/node (for the drag-node chart) using the
$fromLabelmacro.Specify the label of the destination marker (for maps)/node (for the drag-node chart) using the
$toLabelmacro.Specify the data plot, category, connector, and marker labels using the
$labelmacro.
Refer to the code below:
{
"chart": {
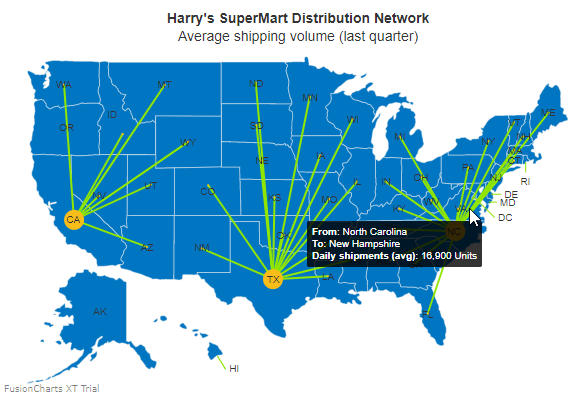
"connectorToolText": "<b>From</b>: $fromLabel <br> <b>To</b>: $toLabel <br> <b>Daily shipments (avg)</b>: $label Units"
}
}The chart will look as shown below:
Click here to edit the above chart.
In the chart above, you can see that the connectorToolText attribute has been used to configure a tooltip for the average shipping volume of a distribution network. The tooltip includes:
Connector source
Connector destination
Average number of shipments made every day for the last quarter, from the source to the destination
Example 3: Tooltip Macros for the Box and Whisker Chart
Create and format the custom tooltip text for data plots using the plotToolText attribute. It accepts macros, plain text, and HTML tags, as strings.
Use the following macros to set a tooltip text for data plots in a box and whisker chart:
Specify the data plot, category, connector, and marker labels using the
$labelmacro.Specify the maximum value (formatted) of the data plot using the
$maxDataValuemacro, or the maximum value (unformatted) using the$maxValuemacro. For example, if the maximum value is 66000, use the$maxDataValuemacro to render it as \$66k, or the$maxValuemacro to render it as 66000.Specify the minimum value (formatted) of the data plot using the
$minDataValuemacro, or the minimum value (unformatted) using the$minValuemacro. For example, if the minimum value is 30000, use the$minDataValuemacro to render it as \$33k, or the$minValuemacro to render it as 33000.Specify the formatted value of the upper quartile of the data plot using the
$Q3macro, or the unformatted value of the upper quartile of the data plot using the$unformattedQ3macro. For example, if the upper quartile value is 60822, use the$Q3macro to render it as \$60.82K, or the$unformattedQ3macro to render it as 60822.Specify the formatted value of the lower quartile of the data plot using the
$Q1macro, or the unformatted value of the lower quartile of the data plot using the$unformattedQ1macro. For example, if the upper quartile value is 41475, use the$Q1macro to render it as \$41.48K, or the$unformattedQ1macro to render it as 41475.Specify the formatted median value of the data plot using the
$medianmacro, or the unformatted median value of the data plot using the$unformattedMedianmacro. For example, if the median value is 50500, use the$medianmacro to render it as \$50.5K, or the$unformattedMedianmacro to render it as 50500.Specify the formatted mean value of the data plot using the
$meanmacro, or the unformatted mean value of the data plot using the$unformattedMeanmacro. For example, if the mean value is 49720, use the$meanmacro to render it as \$49.72K, or the$unformattedMeanmacro to render it as 49720.Specify the formatted standard deviation value of the data plot using the
$SDmacro, or the unformatted standard deviation value of the data plot using the$unformattedSDmacro. For example, if the standard deviation value is 2290, use the$SDmacro to render it as \$2.29K, or the$unformattedSDmacro to render it as 2290.Specify the formatted quartile deviation value of the data plot using the
$QDmacro, or the unformatted quartile deviation value of the data plot using the$unformattedQDmacro. For example, if the quartile deviation value is 9673, use the$QDmacro to render it as \$9.76K, or the$unformattedQDmacro to render it as 9673.Specify the formatted mean deviation value of the data plot using the
$MDmacro, or the unformatted mean deviation value of the data plot using the$unformattedMDmacro. For example, if the mean deviation value is 9113, use the$MDmacro to render it as \$9.11K, or the$unformattedMDmacro to render it as 9113.
Refer to the code below:
{
"chart": {
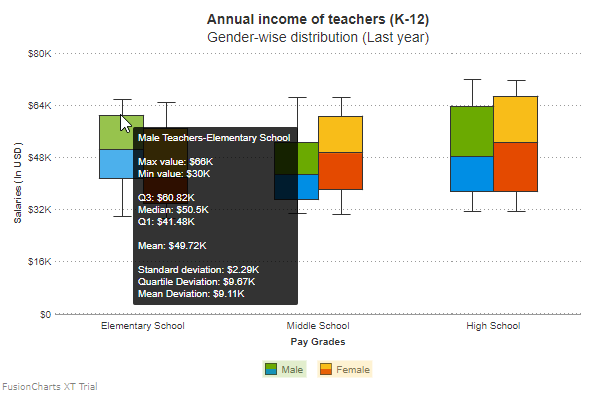
"plotToolText": "$seriesName Teachers-$label <br> <br> Max value: $maxDataValue <br> Min value: $minDataValue <br> <br> Q3: $Q3 <br> Median: $median <br> Q1: $Q1 <br> <br> Mean: $mean <br> <br> Standard deviation: $SD <br> Quartile Deviation: $QD <br> Mean Deviation: $MD"
}
}The chart will look as shown below:
Click here to edit the above chart.
In the chart shown above, tooltip macros for the box and whisker chart have been used to add the mean, quartile deviation, standard deviation, and mean deviation values to the tooltip text.
By default, the tooltip text for the data plots in a box and whisker chart includes the following values:
Minimum value
Maximum value
Upper and lower quartile values
Median
List of Tooltip Macros
| Macro name | Description | Supported by | Format |
|---|---|---|---|
$value |
Represents the unformatted data plot, entity, and marker data values |
|
chart: {plotToolText} axis: {plotToolText} dataset: {plotToolText} data: {toolText} map: {entityToolText} entity: {toolText} map: {markerToolText} marker: {toolText} dial: {toolText} category: {toolText} |
$dataValue |
Represents the formatted data plot, entity, and marker data values |
|
chart: {plotToolText} axis: {plotToolText} dataset: {plotToolText} data: {toolText} map: {entityToolText} entity: {toolText} map: {markerToolText} marker: {toolText} dial: {toolText} category: {toolText} |
$label |
Represents the data plot, category, connector, and marker labels |
|
chart: {plotToolText} dataset: {plotToolText} data: {toolText} map: {connectorToolText} connector: {toolText} map: {markerToolText} marker: {toolText} |
$displayValue |
Represents the value of the displayValue attribute of the data and entity objects |
|
chart: {plotToolText} dataset: {plotToolText} data: {toolText} map: {entityToolText} entity: {toolText} |
$datasValue |
Represents the formatted data plot of the gradient legend | |
chart: {plotToolText} |
$svalue |
Represents the unformatted data plot of the gradient legend | |
chart: {plotToolText} |
$seriesName |
Represents the series name | |
chart: {plotToolText} dataset: {plotToolText} data: {toolText} |
$yAxisName |
Represents the y-axis name | |
chart: {plotToolText} dataset: {plotToolText} data: {toolText} |
$xAxisName |
Represents the x-axis name | |
chart: {plotToolText} dataset: {plotToolText} data: {toolText} |
$xValue |
Represents the x-coordinate (unformatted value) of a data plot | |
chart: {plotToolText} dataset: {plotToolText} data: {toolText} |
$xDataValue |
Represents the x-coordinate (formatted value) of a data plot | |
chart: {plotToolText} dataset: {plotToolText} data: {toolText} |
$yValue |
Represents the y-coordinate (unformatted value) of a data plot | |
chart: {plotToolText} dataset: {plotToolText} data: {toolText} |
$yDataValue |
Represents the y-coordinate (formatted value) of a data plot | |
chart: {plotToolText} dataset: {plotToolText} data: {toolText} |
$zValue |
Represents the z-coordinate (unformatted value) of a data plot | |
chart: {plotToolText} dataset: {plotToolText} data: {toolText} |
$zDataValue |
Represents the z-coordinate (formatted value) of a data plot | |
chart: {plotToolText} dataset: {plotToolText} data: {toolText} |
$name |
Represents the name of a data plot | |
chart: {plotToolText} dataset: {plotToolText} data: {toolText} |
$percentValue |
Represents the corresponding percentage value (formatted number) of a data value | |
chart: {plotToolText} dataset: {plotToolText} data: {toolText} |
$sum |
Represents the sum (formatted) of data values of all/stacked (in stacked charts) data plots | |
chart: {plotToolText} dataset: {plotToolText} data: {toolText} |
$unformattedSum |
Represents the sum (unformatted) of data values of all/stacked (in stacked charts) data plots | |
chart: {plotToolText} dataset: {plotToolText} data: {toolText} |
$cumulativeValue |
Represents the sum (unformatted) of data values upto the current data plot | |
chart: {plotToolText} dataset: {plotToolText} data: {toolText} |
$cumulativeDataValue |
Represents the sum (formatted) of data values upto the current data plot | |
chart: {plotToolText} dataset: {plotToolText} data: {toolText} |
$cumulativePercentValue |
Represents the sum (unformatted) of data values, in percent, upto the current data plot | |
chart: {plotToolText} dataset: {plotToolText} data: {toolText} |
$cumulativePercentDataValue |
Represents the sum (formatted) of data values, in percent, upto the current data plot | |
chart: {plotToolText} dataset: {plotToolText} data: {toolText} |
$xAxisPercentValue |
Represents the x-axis value, in percent, which is covered by the corresponding stack | |
chart: {plotToolText} dataset: {plotToolText} data: {toolText} |
$errorValue |
Represents the error value (unformatted) of a data plot | |
chart: {plotToolText} dataset: {plotToolText} data: {toolText} |
$errorDataValue |
Represents the error value (formatted) of a data plot | |
chart: {plotToolText} dataset: {plotToolText} data: {toolText} |
$errorPercentValue |
Represents the error value, in percent, of a data plot | |
chart: {plotToolText} dataset: {plotToolText} data: {toolText} |
$horizontalErrorValue |
Represents the horizontal error value (unformatted) of a data plot | |
chart: {plotToolText} dataset: {plotToolText} data: {toolText} |
$horizontalErrorDataValue |
Represents the horizontal error value (formatted) of a data plot | |
chart: {plotToolText} dataset: {plotToolText} data: {toolText} |
$verticalErrorValue |
Represents the vertical error value (unformatted) of a data plot | |
chart: {plotToolText} dataset: {plotToolText} data: {toolText} |
$verticalErrorDataValue |
Represents the vertical error value (formatted) of a data plot | |
chart: {plotToolText} dataset: {plotToolText} data: {toolText} |
$horizontalErrorPercent |
Represents the horizontal error value, in percent, of a data plot | |
chart: {plotToolText} dataset: {plotToolText} data: {toolText} |
$verticalErrorPercent |
Represents the vertical error value, in percent, of a data plot | |
chart: {plotToolText} dataset: {plotToolText} data: {toolText} |
$openValue |
Represents the opening value (unformatted) of a data plot | |
chart: {plotToolText} dataset: {plotToolText} data: {toolText} |
$openDataValue |
Represents the opening value (formatted) of a data plot | |
chart: {plotToolText} dataset: {plotToolText} data: {toolText} |
$closeValue |
Represents the closing value (unformatted) of a data plot | |
chart: {plotToolText} dataset: {plotToolText} data: {toolText} |
$closeDataValue |
Represents the closing value (formatted) of a data plot | |
chart: {plotToolText} dataset: {plotToolText} data: {toolText} |
$highValue |
Represents the highest value (unformatted) of a data plot | |
chart: {plotToolText} dataset: {plotToolText} data: {toolText} |
$highDataValue |
Represents the highest value (formatted) of a data plot | |
chart: {plotToolText} dataset: {plotToolText} data: {toolText} |
$lowValue |
Represents the lowest value (unformatted) of a data plot | |
chart: {plotToolText} dataset: {plotToolText} data: {toolText} |
$lowDataValue |
Represents the lowest value (formatted) of a data plot | |
chart: {plotToolText} dataset: {plotToolText} data: {toolText} |
$volumeValue |
Represents the transaction volume value (unformatted) for a data plot | |
chart: {plotToolText} dataset: {plotToolText} data: {toolText} |
$volumeDataValue |
Represents the transaction volume value (formatted) for a data plot | |
chart: {plotToolText} dataset: {plotToolText} data: {toolText} |
$tlLabel |
Represents the top-left corner label of a data plot | |
chart: {plotToolText} dataset: {plotToolText} data: {toolText} |
$trLabel |
Represents the top-right corner label of a data plot | |
chart: {plotToolText} dataset: {plotToolText} data: {toolText} |
$blLabel |
Represents the bottom-left corner label of a data plot | |
chart: {plotToolText} dataset: {plotToolText} data: {toolText} |
$brLabel |
Represents the bottom-right corner label of a data plot | |
chart: {plotToolText} dataset: {plotToolText} data: {toolText} |
$tlType |
Represents the type of the top-left corner label of a data plot | |
chart: {plotToolText} dataset: {plotToolText} data: {toolText} |
$trType |
Represents the type of the top-right corner label of a data plot | |
chart: {plotToolText} dataset: {plotToolText} data: {toolText} |
$blType |
Represents the type of the bottom-left corner label of a data plot | |
chart: {plotToolText} dataset: {plotToolText} data: {toolText} |
$brType |
Represents the type of the bottom-right corner label of a data plot | |
chart: {plotToolText} dataset: {plotToolText} data: {toolText} |
$rowLabel |
Represents the label of the row in which the data plot is located | |
chart: {plotToolText} dataset: {plotToolText} data: {toolText} |
$columnLabel |
Represents the label of the column in which the data plot is located | |
chart: {plotToolText} dataset: {plotToolText} data: {toolText} |
$colorRangeLabel |
Represents the label of the color range to which the data plot belongs | |
chart: {plotToolText} dataset: {plotToolText} data: {toolText} |
$fromXValue |
Represents the x-coordinate of the source node | |
chart: {connectorToolText} connectors: {connectorToolText} connector: {toolText} |
$fromXDataValue |
Represents the x-coordinate (formatted) of the source node | |
chart: {connectorToolText} connectors: {connectorToolText} connector: {toolText} |
$fromYValue |
Represents the y-coordinate of the source node | |
chart: {connectorToolText} connectors: {connectorToolText} connector: {toolText} |
$fromYDataValue |
Represents the y-coordinate (formatted) of the source node | |
chart: {connectorToolText} connectors: {connectorToolText} connector: {toolText} |
$fromLabel |
Represents the label of the source node | |
chart: {connectorToolText} connectors: {connectorToolText} connector: {toolText} |
$toXValue |
Represents the x-coordinate of the destination node | |
chart: {connectorToolText} connectors: {connectorToolText} connector: {toolText} |
$toXDataValue |
Represents the x-coordinate (formatted) of the destination node | |
chart: {connectorToolText} connectors: {connectorToolText} connector: {toolText} |
$toYValue |
Represents the y-coordinate of the destination node | |
chart: {connectorToolText} connectors: {connectorToolText} connector: {toolText} |
$toYDataValue |
Represents the y-coordinate (formatted) of the destination node | |
chart: {connectorToolText} connectors: {connectorToolText} connector: {toolText} |
$toLabel |
Represents the label of the destination node | |
chart: {connectorToolText} connectors: {connectorToolText} connector: {toolText} |
$maxValue |
Represents the maximum value (unformatted) of the data plot | |
chart: {plotToolText} | {outlierToolText} | {meanToolText} | {SDToolText} | {QDToolText} | {MDToolText} dataset: {plotToolText} | {outlierToolText} | {meanToolText} | {SDToolText} | {QDToolText} | {MDToolText} data: {toolText} | {outlierToolText} | {meanToolText} | {SDToolText} | {QDToolText} | {MDToolText} |
$maxDataValue |
Represents the maximum value (formatted) of the data plot | |
chart: {plotToolText} | {outlierToolText} | {meanToolText} | {SDToolText} | {QDToolText} | {MDToolText} dataset: {plotToolText} | {outlierToolText} | {meanToolText} | {SDToolText} | {QDToolText} | {MDToolText} data: {toolText} | {outlierToolText} | {meanToolText} | {SDToolText} | {QDToolText} | {MDToolText} |
$minValue |
Represents the minimum value (unformatted) of the data plot | |
chart: {plotToolText} | {outlierToolText} | {meanToolText} | {SDToolText} | {QDToolText} | {MDToolText} dataset: {plotToolText} | {outlierToolText} | {meanToolText} | {SDToolText} | {QDToolText} | {MDToolText} data: {toolText} | {outlierToolText} | {meanToolText} | {SDToolText} | {QDToolText} | {MDToolText} |
$minDataValue |
Represents the minimum value (formatted) of the data plot | |
chart: {plotToolText} | {outlierToolText} | {meanToolText} | {SDToolText} | {QDToolText} | {MDToolText} dataset: {plotToolText} | {outlierToolText} | {meanToolText} | {SDToolText} | {QDToolText} | {MDToolText} data: {toolText} | {outlierToolText} | {meanToolText} | {SDToolText} | {QDToolText} | {MDToolText} |
$Q1 |
Represents the value of the lower quartile of the data plot | |
chart: {plotToolText} | {QDToolText} dataset: {plotToolText} | {QDToolText} data: {toolText} | {QDToolText} |
$unformattedQ1 |
Represents the unformatted value of the lower quartile of the data plot | |
chart: {plotToolText} | {QDToolText} dataset: {plotToolText} | {QDToolText} data: {toolText} | {QDToolText} |
$Q3 |
Represents the value of the upper quartile of the data plot | |
chart: {plotToolText} | {QDToolText} dataset: {plotToolText} | {QDToolText} data: {toolText} | {QDToolText} |
$unformattedQ3 |
Represents the unformatted value of the upper quartile of the data plot | |
chart: {plotToolText} | {QDToolText} dataset: {plotToolText} | {QDToolText} data: {toolText} | {QDToolText} |
$SD |
Represents the standard deviation value of the data plot | |
chart: {plotToolText} | {SDToolText} dataset: {plotToolText} | {SDToolText} data: {toolText} | {SDToolText} |
$unformattedSD |
Represents the unformatted standard deviation value of the data plot | |
chart: {plotToolText} | {SDToolText} dataset: {plotToolText} | {SDToolText} data: {toolText} | {SDToolText} |
$QD |
Represents the quartile deviation value of the data plot | |
chart: {plotToolText} | {QDToolText} dataset: {plotToolText} | {QDToolText} data: {toolText} | {QDToolText} |
$unformattedQD |
Represents the unformatted quartile deviation value of the data plot | |
chart: {plotToolText} | {QDToolText} dataset: {plotToolText} | {QDToolText} data: {toolText} | {QDToolText} |
$MD |
Represents the mean deviation value of the data plot | |
chart: {plotToolText} | {MDToolText} dataset: {plotToolText} | {MDToolText} data: {toolText} | {MDToolText} |
$unformattedMD |
Represents the unformatted mean deviation value of the data plot | |
chart: {plotToolText} | {MDToolText} dataset: {plotToolText} | {MDToolText} data: {toolText} | {MDToolText} |
$mean |
Represents the mean value of the data plot | |
chart: {plotToolText} | {meanToolText} dataset: {plotToolText} | {meanToolText} data: {toolText} | {meanToolText} |
$unformattedMean |
Represents the unformatted mean value of the data plot | |
chart: {plotToolText} | {meanToolText} dataset: {plotToolText} | {meanToolText} data: {toolText} | {meanToolText} |
$median |
Represents the median value of the data plot | |
chart: {plotToolText} | {meanToolText} dataset: {plotToolText} | {meanToolText} data: {toolText} | {meanToolText} |
$unformattedMedian |
Represents the unformatted median value of the data plot | |
chart: {plotToolText} | {meanToolText} dataset: {plotToolText} | {meanToolText} data: {toolText} | {meanToolText} |
$targetValue |
Represents the unformatted target value | |
chart: {plotToolText} | {meanToolText} dataset: {plotToolText} | {meanToolText} data: {toolText} | {meanToolText} |
$targetDataValue |
Represents the formatted target value | |
chart: {plotToolText} | {meanToolText} dataset: {plotToolText} | {meanToolText} data: {toolText} | {meanToolText} |
$percentOfPrevValue |
Represents the current value as a percentage (unformatted) of the previous value Applicable only when the streamlinedData attribute is set to 1 |
|
chart: {plotToolText} | {meanToolText} dataset: {plotToolText} | {meanToolText} data: {toolText} | {meanToolText} |
$start |
Represents the start time of a task | |
chart: {plotToolText} tasks: {plotToolText} task: {toolText} |
$end |
Represents the end time of a task | |
chart: {plotToolText} tasks: {plotToolText} task: {toolText} |
$label |
Represents the task label | |
chart: {plotToolText} tasks: {plotToolText} task: {toolText} |
$percentComplete |
Represents the percent complete rate of a task | |
chart: {plotToolText} tasks: {plotToolText} task: {toolText} |
$date |
Represents the milestone date | |
chart: {milestoneToolText} milestone: {toolText} |
$taskStartDate |
Represents the start date of a task for the milestone | |
chart: {milestoneToolText} milestone: {toolText} |
$taskEndDate |
Represents the end date of a task for the milestone | |
chart: {milestoneToolText} milestone: {toolText} |
$taskLabel |
Represents the task label for the milestone | |
chart: {milestoneToolText} milestone: {toolText} |
$taskPercentComplete |
Represents the percent complete rate of a task for the milestone | |
chart: {milestoneToolText} milestone: {toolText} |
$processName |
Represents the name of a process for the milestone | |
chart: {milestoneToolText} milestone: {toolText} |
$sName |
Represents the short name of an entity | |
map: {entityToolText} entity: {toolText} |
$lName |
Represents the long name of an entity | |
map: {entityToolText} entity: {toolText} |
$fromID |
Represents the ID of the marker from which the connector starts | |
map: {connectorToolText} connector: {toolText} |
$fromLabel |
Represents the label of the marker from which the connector starts | |
map: {connectorToolText} connector: {toolText} |
$toID |
Represents the ID of the marker at which the connector ends | |
map: {connectorToolText} connector: {toolText} |
$toLabel |
Represents the label of the marker at which the connector ends | |
map: {connectorToolText} connector: {toolText} |
$startValue |
Represents the starting value (unformatted) of a trend-line/trend-zone | |
trendLines: {toolText} line: {toolText} |
$startDataValue |
Represents the starting value (formatted) of a trend-line/trend-zone | |
trendLines: {toolText} line: {toolText} |
$endValue |
Represents the ending value (unformatted) of a trend-line/trend-zone | |
trendLines: {toolText} line: {toolText} |
$endDataValue |
Represents the ending value (formatted) of a trend-line/trend-zone | |
trendLines: {toolText} line: {toolText} |
$displayValue |
Represents the display of a trend-line/trend-zone | |
trendLines: {toolText} line: {toolText} |
$axisName |
Represents the axis name against which the trend-line/trend-zone is plotted | |
trendLines: {toolText} line: {toolText} |
$positiveErrorValue |
It refers to the unformatted positiveErrorValue provided by the user for individual data plot. By default, this is inherited from errorValue |
|
Left |
$positiveErrorDataValue |
It refers to the formatted positiveErrorValue provided by the user for individual data plot. By default, this is inherited from errorValue |
|
Left |
$negativeErrorValue |
It refers to the unformatted negativeErrorValue provided by the user for individual data plot. By default, this is inherited from errorValue |
|
Left |
$negativeErrorDataValue |
It refers to the formatted negativeErrorValue provided by the user for individual data plot. By default, this is inherited from errorValue |
|
Left |
$horizontalPositiveErrorValue |
It refers to the unformatted horizontalPositiveErrorValue provided by the user for individual data plot. By default, this is inherited from errorValue / horizontalErrorValue |
|
Left |
$horizontalPositiveErrorDataValue |
It refers to the formatted horizontalPositiveErrorValue provided by the user for individual data plot. default: inherited from errorValue / horizontalErrorValue |
|
Left |
$horizontalNegativeErrorValue |
It refers to the unformatted horizontalNegativeErrorValue provided by the user for individual data plot. By default, this is inherited from errorValue / horizontalErrorValue |
|
Left |
$horizontalNegativeErrorDataValue |
It refers to the formatted horizontalNegativeErrorValue provided by the user for individual data plot. By default, this is inherited from errorValue / horizontalErrorValue |
|
Left |
$verticalPositiveErrorValue |
It refers to the unformatted verticalPositiveErrorValue provided by the user for individual data plot. By default, this is inherited from errorValue / verticalErrorValue |
|
Left |
$verticalPositiveErrorDataValue |
It refers to the formatted verticalPositiveErrorValue provided by the user for individual data plot. By default, this is inherited from errorValue / verticalErrorValue |
|
Left |
$verticalNegativeErrorValue |
It refers to the unformatted verticalNegativeErrorValue provided by the user for individual data plot. By default, this is inherited from errorValue / verticalErrorValue |
|
Left |
$verticalNegativeErrorDataValue |
It refers to the formatted verticalNegativeErrorValue provided by the user for individual data plot. By default, this is inherited from errorValue / verticalErrorValue |
|
Left |
$nodeValue |
Gets the unformatted value from a node. | |
chart: {plotToolText}node: {plotToolText} |
$nodeDataValue |
Gets the formatted value from a node. | |
chart: {plotToolText}node: {toolText} |
$plotFillColor |
Gets the fill color of a node in hex format. | |
chart: {plotToolText}node: {toolText} |
$plotFillAlpha |
Gets the fill alpha (transparency) of a node. | |
chart: {plotToolText}node: {toolText} |
$plotIdentifier |
Gets the legend icon shape defined in the legend box. | |
chart: {plotToolText}node: {toolText} |
$dominantNode |
Gets the label (name) of the dominant node. | |
chart: {linkToolText}link: {toolText} |
$subservientNode |
Gets the label (name) of the subservient node. | |
chart: {linkToolText}link: {toolText} |
$dominantFlowValue |
Gets the unformatted value of the dominant flow. | |
chart: {linkToolText}link: {toolText} |
$dominantFlowDataValue |
Gets the formatted value of the dominant flow. | |
chart: {linkToolText}link: {toolText} |
$subservientFlowValue |
Gets the unformatted value of the subservient flow. | |
chart: {linkToolText}link: {toolText} |
$subservientFlowDataValue |
Gets the formatted value of the subservient flow. | |
chart: {linkToolText}link: {toolText} |
$dominantPlotIdentifier |
Gets the legend icon shape of the dominant node. | |
chart: {linkToolText}link: {toolText} |
$subservientPlotIdentifier |
Gets the legend icon shape of the subservient node. | |
chart: {linkToolText}link: {toolText} |
$from |
Gets the value of the "from" node label. | |
chart: {linkToolText}link: {toolText} |
$to |
Gets the value of the "to" node label. | |
chart: {linkToolText}link: {toolText} |
$linkValue |
Gets the unformatted value of the link. | |
chart: {linkToolText}link: {toolText} |
$linkDataValue |
Gets the formatted value of the link. | |
chart: {linkToolText}link: {toolText} |
$fromPlotIdentifier |
Gets the legend icon shape of the "from" node. | |
chart: {linkToolText}link: {toolText} |
$toPlotIdentifier |
Gets the legend icon shape of the "to" node. | |
chart: {linkToolText}link: {toolText} |
$flowDirection |
Gets the flow direction, an arrow shape from left to right. | |
chart: {linkToolText}link: {toolText} |