This section is meant for users who have implemented v3.x.y (e.g., 3.0.2, 3.0.1, 3.1.1 etc.) of FusionWidgets in their applications and are now upgrading to FusionWidgets XT (v3.2).
Here, we will discuss the following:
- Steps to upgrade to FusionWidgets XT from FusionWidgets v3.x.y
-
- Enabling your charts to run on iPad and iPhone and in devices where Flash Player is not available
- Converting all your charts/gauges from Flash rendering to JavaScript rendering
- Rendering pure JavaScript charts
- Creating dynamically resizable gauges and charts
- Creating dynamically resizable annotations
- Using macros in annotations
- Using FusionCharts JavaScript Class
- Changing individual chart attribute at run-time using JavaScript
- Making use of new JavaScript events
- Making use of new real-time update events
- Enabling managed printing in Firefox/Chrome/Safari/Opera
- Using LinkedCharts
- Adding support for JSON data
- Using FusionCharts jQuery plugin to render charts/gauges
- Handling real-time charts and gauges using FusionCharts jQuery plugin
- Making real-time charts update instantly after first render
- Using smarter real-time value padding
- Showing legend in Funnel and Pyramid charts
- Setting display modes of background image
- Setting alignment of background image
- Using the default font size of the caption and sub caption
- Controlling alignment of caption and sub-caption
- Specifying y-axis minimum value (lower limit) for Stacked charts
Moreover, for users having FusionWidgets earlier to v3.1 we will discuss:
- Features introduced in FusionWidgets v3.1
- Features of FusionWidgets v3.0.7 dropped in FusionWidgets v3.1 and above
All the features of FusionWidgets XT (v3.2) are backward compatible with FusionWidgets v3.1. Hence, upgrading is as easy as copy-pasting files. Listed below are the things that you need to take care of while upgrading:
- Copy all the chart SWF files from Download Pack > Charts folder and replace your existing chart SWF files in your deployed folder
- Copy the new FusionCharts.js from Download Pack > Charts folder and over-write the existing FusionCharts.js in your deployed application folder
- Copy the 3 new JavaScript files - FusionCharts.HC.js, FusionCharts.HC.Widgets.js and jquery.min.js from Download Pack > Charts folder to the same folder as FusionCharts.js
- Clear your browser cache (very important step)
In case, you are also using charts from FusionCharts XT or earlier version, you need to download or update to the latest FusionCharts pack and copy FusionCharts.HC.Charts.js from the Charts folder of the downloaded FusionCharts pack.
Moreover, if you are using charts from PowerCharts 3.2 or earlier version, you need to download or update to the latest PowerCharts pack and copy FusionCharts.HC.PowerCharts.js from the Charts folder of the downloaded PowerCharts pack.
The above steps will convert all your FusionWidgets v3.x.y gauges/charts to FusionWidgets XT. You don't have to modify any code, as all the charts are backward compatible.
FusionWidgets XT (v3.2) boasts of a plethora of enhancements. To make use of the new and modified features, you will have to modify your code to include the same. Given below are details of code changes required for implementing some of the new features introduced in FusionWidgets XT (v3.2).
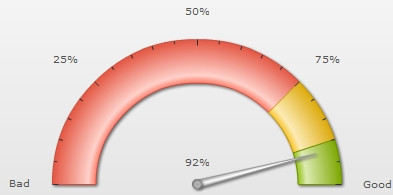
To get you started with FusionWidgets XT, we will show you how to build a simple Angular Gauge. Let's start with a simple�"Customer Satisfaction index in percentage" for a fictional company, which we will plot in an �Angular Gauge (dial/speedometer chart). Once done, it should look as under, although with animation and interactivity when you view it live.
Follow the steps below to get started:
- Create a folder named LearningFusionWidgets on your hard-drive. We'll use this folder as the root folder for building all the FusionWidgets XT examples.
- Create a folder named MyFirstChart inside the above folder. Inside MyFirstChart folder, create a folder named Charts.
- Copy FusionCharts.js, FusionCharts.HC.js, FusionCharts.HC.Widgets.js and jquery.min.js files from Download Pack > Charts folder to your Charts folder. These JavaScript files help you easily embed FusionWidgets XT in your page and also render the chart in JavaScript.
- Specify the name of the chart type, that is the JavaScript alias. In this case we will use AngularGauge.
- If you want to render Flash charts, copy AngularGauge.swf from Download Pack > Charts folder to the Charts folder you have just created. This is the SWF file required to render this chart in Flash.
- Create an XML file » (Creating an XML file is as easy as creating a text file using Windows Notepad or any other text editor. It is actually a plain text file with extension - xml) in MyFirstChart folder with name Data.xml.
- Copy the code given below to Data.xml file. It is the XML-lized form of the customer satisfaction index (which is 92 in this example).
<chart lowerLimit="0" upperLimit="100" lowerLimitDisplay="Bad" upperLimitDisplay="Good" numberSuffix="%" showValue="1">
  <colorRange>
    <color minValue="0" maxValue="75" code="FF654F"/>
    <color minValue="75" maxValue="90" code="F6BD0F"/>
    <color minValue="90" maxValue="100" code="8BBA00"/>
  </colorRange>
  <dials>
    <dial value="92"/>
  </dials>
</chart>
- Create an HTML file (using a text editor like Notepad, TextMate etc. or the Web Development software you use) in MyFirstChart folder and copy-paste the code given below and save it as customer-satisfaction.html:
<html>
<head>
<title>My First chart using FusionWidgets XT</title>
	<script type="text/javascript" src="Charts/FusionCharts.js">
	</script>
</head>
<body>
	<div id="chartContainer">FusionWidgets XT will load here!</div>
	<script type="text/javascript"><!--
		var myChart = new FusionCharts( "AngularGauge", "myChartId", "400", "200", "0");
		myChart.setXMLUrl("Data.xml");
		myChart.render("chartContainer");
	// -->
	</script>
</body>
</html>
And that completes the recipe!
Open the HTML file (customer-satisfaction.html) in a Web Browser » Internet Explorer, Firefox, Opera, Chrome or Safari (Mac/iPhone/iPad/Windows) and you will see an Angular Gauge similar to the one below:
See it live!
Here, we will discuss about how to create charts in Flash using FusionWidgets XT. We will use the same example of "Customer Satisfaction index in percentage" for a fictional company, which we will plot in�an �Angular Gauge (dial/speedometer chart).
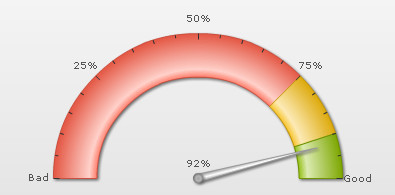
For this example, create a copy of customer-satisfaction.html and save it as customer-satisfaction-flash.html in the same folder. Finally, edit the HTML code and replace the JavaScript alias AngularGauge with the chart SWF file AngularGauge.swf. Let's see how the change is incorporated in the HTML code (in your web page).
<html>
<head>
<title>My First chart using FusionWidgets XT - Using Flash</title>
	<script type="text/javascript" src="Charts/FusionCharts.js">
	</script>
</head>
<body>
	<div id="chartContainer">FusionWidgets XT will load here!</div>
	<script type="text/javascript"><!--
		var myChart = new FusionCharts( "Charts/AngularGauge.swf", "myChartId", "400", "200", "0");
		myChart.setXMLUrl("Data.xml");
		myChart.render("chartContainer");
	// -->
	</script>
</body>
</html>
And that completes the recipe!
Open the HTML file (customer-satisfaction-flash.html) in a Web Browser » Internet Explorer, Firefox, Opera, Chrome or Safari (Mac/iPhone/iPad/Windows) and you will see an Angular Gauge similar to the one below:
See it live!
Starting FusionWidgets XT v3.3.0, JavaScript charts can be exported and saved to a server disk. To do so, you need to configure your own server. The sever should support PHP and JAVA (1.3 or above). Also, you need to place the FusionCharts PHP export handler and Apache Batik SVG Rasterizer library in your server.
The XML or JSON data will be as shown under:
<chart... exportAction='save' >
...
</chart>
or
"chart": {
      ...
      "exportAction" : "save"
    },
...
);
To know more on how to set up and configure the server click here.
FusionWidgets XT v3.3.0 also allows you to customize the labels of the export context menu. By default, the labels appear as Download as PNG, Download as JPG, Download as PDF and Download as SVG. To achieve this, you need to use the exportFormats attribute. The attribute value should be a delimiter separated key-value pair. The delimiter character to be used is '|' (pipe character). The syntax for the attribute value exportFormats='KEY=Value|KEY=Value'. The XML or JSON data will look as under:
<chart... exportFormats='PNG=Export as High Quality Image|JPG|PDF=Export as PDF File|SVG' >
...
</chart>
or
"chart": {
      ...
      "exportFormats" : "PNG=Export as High Quality Image|JPG|PDF=Export as PDF File|SVG"
    },
...
);
In the above data, the labels of PNG and PDF has been customized. Since, no value has been set to JPG and SVG they will appear with its default label, which is Download as JPG and Download as SVG. The order of the options will appear as set in this attribute.
Note:If you do skip any export option in this attibute the context menu will not display that option. For example, if you set exportFormats='PNG=Export as High Quality Image|JPG|PDF=Export as PDF File' the context menu will appear without the SVG option since it is not mentioned in the attribute.
After you've made the changes based on the steps to upgrade discussed above, your gauges and charts are automatically ready for iPad/iPhone. This has been made possible by the new FusionCharts.js (core class of FusionCharts JavaScript Class), which provides automatic fallback of charts (using FusionCharts.HC.js, FusionCharts.HC.Widgets.js and jquery.min.js). FusionCharts JavaScript Class (in FusionWidgets XT pack) is capable of detecting whether the browser is running in iPad, iPhone or iPod and it switches to pure JavaScript rendering architecture. Click here to see a live sample in your iPad/iPhone.
|
|
|
JavaScript rendering is NOT supported by the following chart:
- Gantt chart
Click here to know how JavaScript gauges and charts are different from the Flash counterparts.
If you want to use JavaScript charting only (and not use Flash at all), you can convert your existing charts/gauges to pure JavaScript charts/gauges (HTML5) by adding a single line of code. All you need to do is write the following code before you call FusionCharts constructor in your existing implementation:
// This line helps in converting all existing Flash charts and gauges to JavaScript charts and gauges
FusionCharts.setCurrentRenderer('javascript');
|
|
|
JavaScript rendering is NOT supported by the following chart:
- Gantt chart
Click here to know how JavaScript gauges and charts are different from the Flash counterparts.
The code below will help to illustrate this:
<html>
  <head>
    <title>My First chart using FusionWidgets XT - Using JavaScript</title>
    <script type="text/javascript" src="FusionWidgets/FusionCharts.js"></script>
  </head>
  <body>
    <div id="chartContainer">FusionWidgets XT will load here!</div>
    <script type="text/javascript"><!--
	FusionCharts.setCurrentRenderer('javascript');
	var myChart = new FusionCharts( "Charts/AngularGauge.swf","myChartId", "400", "300", "0", "1" );
	myChart.setXMLUrl("Data.xml");
	myChart.render("chartContainer");
    // -->
    </script>
  </body>
</html>
See it live!
Note : Many browsers restrict JavaScript from accessing local file system owing to security reasons. The JavaScript charts, when running locally, will not be able to access data provided as a URL. If you run the files from a server, it will run absolutely fine, though. When running locally, however, if you provide the data as string (using the Data String method), it works fine.
Starting FusionWidgets XT - Service Release 1, you can specify the JavaScript chart alias (as listed in the Chart List page) instead of the chart SWF filename to create a pure JavaScript chart. The code snippet below demonstrates how this is achieved:
<html>
  <head>
    <title>Creating Pure JavaScript chart</title>
    <script type="text/javascript" src="FusionCharts/FusionCharts.js"></script>
  </head>
  <body>
    <div id="chartContainer">FusionWidgets XT will load here!</div>
    <script type="text/javascript"><!--

      var myChart = new FusionCharts( "AngularGauge", "myChartId", "400", "300" );
      myChart.setXMLUrl("Data.xml");
      myChart.render("chartContainer");
    // -->
    </script>
  </body>
</html>
See it live!
In the above code, instead of AngularGauge.swf we have specified AngularGauge, the JavaScript chart alias. Based on the JavaScript chart alias provided, FusionCharts JavaScript Class renders the respective JavaScript chart.
Also note that we have removed the line FusionCharts.setCurrentRenderer('javascript'); from the code. This is because, FusionCharts JavaScript Class automatically switches to JavaScript rendering mode whenever JavaScript chart alias is provided.
You can also specify JavaScript chart alias while using the Object as Constructor parameter through the type property as shown below:
 var myChart = new FusionCharts( {
	type: 'AngularGauge',
	width: '400',
	height: '300',
	debugMode : false
});
Starting FusionWidgets XT (v3.2), all gauges and charts can resize automatically as per the changed size of the container element. The charts can accept width and height in percentage (%) and scale in percentage with respect to the containers' size. Whenever a container's size changes, the chart automatically resizes itself with respect to the new size of the container element. To achieve this, all you need to do is:
- Set percentage values as the chart's width and height
new FusionCharts("AngularGauge.swf","myChartId", "80%", "100%", "0", "1");
- Set manageResize="1" in <chart> element
<chart manageResize='1' ...>
All charts and gauges in FusionWidgets XT can now resize automatically as per the changed size of the container element.
For more details on dynamic-resizing, please see the Dynamic Resizing page from the Angular Gauge section.
In the example below, we've created a very basic sample where the chart will fill up the whole web browser's space. When the browser's size is changed, the chart will resize itself.
<html>
  <head>
    <title>My First chart - Using dynamically re sizable chart</title>
    	<script type="text/javascript" src="FusionCharts/FusionCharts.js"></script>
  </head>
<body style="height:100%;">
    <div id="chartContainer" style="height:100%;" >Chart will load here</div>
	<script type="text/javascript"><!--
		var myChart = new FusionCharts("FusionCharts/AngularGauge.swf", "myChartId", "100%", "100%", "0", "1");
		myChart.setXMLUrl("ClockConfiguration.xml");
		myChart.render("chartContainer");
	// -->
	</script>
</body>
</html>
Click here to view a dynamically resizable clock which fills up the browser window and resizes when the browser window resizes.
In the above code we have:
- Set the height of the body to be 100%
- Set the height of the container DIV to 100%, which means that it will vertically fill up the body space of the HTML
- Set the chart's width and height to 100%
Moreover, we have set manageResize='1' in the <chart> element of the chart's data (ClockConfiguration.xml).
This makes the chart resize itself automatically whenever the browser's dimensions change.
You can apply the same concept to HTML containers. All you need to do is set the chart with percentage width and height, set manageResize='1' and put it inside the container. Click here to check out a live example of how a gauge dynamically resizes itself based on a resizable container.
Note: The dynamic resizing feature does not work if autoScale attribute is set to 0.
Starting FusionWidgets XT, Annotations present in a chart/gauge can also resize dynamically along with the dynamically resizable charts/gauge. For this, you need to make the chart/gauge dynamically resizable by:
- Setting percentage dimensions to the chart/gauge
- Making the container of the chart/gauge capable of resizing (due to user interaction or using code)
- Setting manageResize="1" in the <chart> element
By default, when a chart is rendered initially (before resizing), it draws the annotations based on the coordinates and size provided in the XML/JSON. It does not scale the annotations.
On further resizing (dynamically), the annotation groups and the annotation elements are scaled in the following way:
- The x and y positions of the annotation groups are first re-calculated and scaled.
- Scaling of the x and y positions of the annotation groups is done without maintaining proportions.
- Scaling is not applied on the values passed through the xShift and yShift attributes.
- Scaling is also not applied on the values provided by annotation macros. However, the numeric values (if not prefixed by a $) present in the macro expressions are scaled.
- Scaling is further applied on the position (x, y, toX and toY) and size (radius etc.) of the annotation elements.
- All the annotation elements (rectangle, line, arc, circle, and polygon) are scaled proportionally, i.e., preserving the proportions of the shapes to avoid distortion. To maintain proportion, the annotations scale based on the least change between the height and the width.
- You can scale the line and rectangle annotations without maintaining proportions by setting constrainedScale='0'.
- To allow scaling of text and image annotations, you need to set scaleText='1' and scaleImages='1' respectively, in the <annotationGroup> element.
Note: The dynamic resizing feature does not work if autoScale attribute is set to 0. This attribute can be set in the <chart> or <annotations> element.
- Position the annotation groups (using x, y, xShift and yShift attributes) with respect to the other elements of the gauge. For example, align the annotation groups' origins with center of an angular gauge.
- Position an annotation element relative to the position of its annotation group.
- Make proper use of the newly introduced macros for annotations to set dynamic positions to the annotation groups and individual annotation elements.
If you are already using the Auto Scale feature of FusionWidgets v3.1.1 (setting autoScale='1' in the <chart>, <annotations> or <annotationGroup> element) to auto-scale annotations, you can continue to use it in FusionWidgets XT without facing any problem.
However, if you want to use the dynamic resizing feature and macros introduced in FusionWidgets XT, you can set manageResize='1'. Also, please note that you may require to tweak your existing annotations to make them work (without getting distorted) in dynamically resizable charts. While tweaking, please remember the following:
- Position the annotation groups (using x, y, xShift and yShift attributes) with respect to the other elements of the gauge. For example, align the annotation groups' origins with center of an angular gauge.
- Position an annotation element relative to the position of its annotation group.
- Make proper use of the newly introduced macros for annotations to set dynamic positions to the annotation groups and individual annotation elements.
- Unconstrained scaling on circle, arc and polygons will not be applied while using the dynamic resizing feature.
FusionWidgets XT introduces macros for annotations - pre-defined variables which assume values at run-time. These values are generated dynamically based on various configurations of a chart or gauge. The macros can be set as the value for the x and y positions of an annotation or annotation group. For example, the macro $chartCenterX always provides the horizontal-center position of a chart or gauge. If you want to place a circle annotation at the center of a chart or gauge, set x="$chartCenterX" and y="$chartCenterY" while defining the circle annotation. The circle will be placed at the center of the chart or gauge.
Again, the values provided by the macros change dynamically when a chart or gauge resizes. Thus, irrespective of the size of a chart or gauge, the circle is always placed at the center of the chart or gauge.
Additionally, using macro expressions, you can add numeric (integer) values to the macros or subtract numeric (integer) values from macros. For example, if you want to create a line 10 pixel from the top of the chart you can set y="$ChartStartY+10" while defining the line annotation. Again, if you want a line to be 10 pixel inside the right margin of the chart, you can set x="$ChartEndX-10".
Important Note: While using the dynamic resizing feature, the values provided by macros are not scaled. Rather, these values are re-set with the new values provided by the resized chart. However, the numeric values present in the macro expressions are scaled. For example, the value 10 in the expression $chartStartY+10 is scaled while using dynamic resizing. If do not want this numeric part to be scaled while using the dynamic resizing feature, you need to prefix the number with $. For example, the value 10 in the expression $chartStartY+$10 is NOT scaled while using dynamic resizing.
For more details on Macros for annotations, read Annotations > Using Macros page.
Starting FusionWidgets XT, FusionCharts JavaScript Class provides a large set of APIs. Using these, you can do the following:
- Create pure JavaScript charts (not Flash)
- Use the object oriented JavaScript implementation methods
- Make use of new data providing functions like setXMLUrl, setXMLData, setChartData, setChartDataUrl
- Use the static function FusionCharts to access all chart instances present in a page
- Configure and create 'LinkedCharts' which is a smart drill-down feature
- Make use of the better printing support for all Mozilla based browsers using the PrintManager class
- Debug and manage errors
- Set properties of an existing chart using setChartAttribute() function
- Provide chart data in JSON format using setJSONUrl, setJSONData, setChartData, setChartDataUrl functions
- Update an existing chart's data using chart's native AJAX capabilities or browser's AJAX support
- Use API to get data back from chart in XML/JSON/CSV format
- Check the rendering state of a chart using function like isActive()
- Duplicate an existing chart's configurations using clone() function
- Remove and clean a chart object and free as much memory as possible using dispose() function
- Make use of better and advanced JavaScript event model (using addEventListener function) to listen to all events
Existing JavaScript implementations using setDataURL(), setDataXML(), FC_Rendered event, FC_DataUpdated event etc. will continue to function without any problem.
FusionCharts JavaScript Class provides an option to set a chart attribute at run-time. This is as easy as calling a simple function. You just need to get the chart handler object and call setChartAttribute() function. Let's see a sample code where we change the caption of the chart:
var weekly_sales_chart = FusionCharts.items['JanuaryChartId'];
weekly_sales_chart.setChartAttribute( "caption", "Updated Sales figures for the month of January" );
In the code above, we get the chart handler from FusionCharts.items Array passing the DOMId of the chart. Next, we call setChartAttribute() function and pass two parameters to it. The first parameter is the name of the attribute that needs to be changed. The second parameter provides the new value of the attribute that needs to be set. Here we pass "caption" as the attribute name and set its new value to "Updated Sales figures for the month of January".
In FusionWidgets XT (v3.2), whenever an attribute of chart is changed, the entire chart is re-drawn without animation.
FusionCharts JavaScript Class allows you to handle events using advanced JavaScript event model. You can use addEventListener() function to each chart object or global FusionCharts class to listen to various events related to chart loading, rendering, resizing, creating LinkedCharts, printing, error handling etc. If you intend to make use of the new JavaScript events or methods, you'll have to make the necessary modifications in your code. You need to get the chart reference and define the event listener function. You can define a function separately and pass the reference to the function to the addEventListener(). You can also declare an anonymous function along with the addEventListener() function call itself. The code snippets below describe how to use the two models:
<html>
<head>
<title>FusionCharts - listen to DrawComplete event</title>
	<script type="text/javascript" src="FusionCharts/FusionCharts.js">
	</script>
</head>
<body>
	<div id="chartContainer">Funnel will load here!</div>
	<script type="text/javascript"><!--
		var myChart = new FusionCharts( "FusionCharts/Funnel.swf", "myChartId", "400", "300", "0", "1" );
		myChart.setXMLUrl("Data.xml");
		myChart.render("chartContainer");
		function myChartListener(event, parameter){
			alert( event.sender.id + " has completed chart drawing" );
			}
		FusionCharts("myChartId").addEventListener ("DrawComplete" , myChartListener );
	// -->
	</script>
</body>
</html>
<html>
<head>
<title>FusionCharts - listen to DrawComplete event</title>
	<script type="text/javascript" src="FusionCharts/FusionCharts.js">
	</script>
</head>
<body>
	<div id="chartContainer">Funnel will load here!</div>
	<script type="text/javascript"><!--
		var myChart = new FusionCharts( "FusionCharts/Funnel.swf", "myChartId", "400", "300", "0", "1" );
		myChart.setXMLUrl("Data.xml");
		myChart.render("chartContainer");
		FusionCharts("myChartId").addEventListener ("DrawComplete" ,
		function(event, parameter){
			alert( event.sender.id + " has completed chart drawing" );
		}
		);
	// -->
	</script>
</body>
</html>
The above code listens to DrawComplete event and shows a JavaScript alert when the event gets fired. To get details of each event please read FusionWidgets XT and JavaScript > API Reference > Events page.
Existing JavaScript implementations using FC_Rendered, FC_Loaded or FC_ChartUpdated events will continue to function without any problem.
FusionWidgets XT (v3.2) introduces two new events to track real-time updates on charts and gauges. The names of the two events are: RealtimeUpdateComplete and RealtimeUpdateError.
RealtimeUpdateComplete event is raised when a real-time gauges or chart completes updating data.
Example implementation:
FusionCharts("myChartId").addEventListener ("RealtimeUpdateComplete" ,
	function(event, parameter)
	{
	  alert( event.sender.id + " has updated data." );
	}
);
Existing JavaScript implementations using FC_ChartUpdated event will continue to function without any problem.
Click here to view a live demo.
RealtimeUpdateError event is raised when error occurs while updating data in a real-time gauge or chart. This event passes the HTTP Status (as number) of the error occurred.
Example implementation:
FusionCharts("myChartId").addEventListener ("RealtimeUpdateError" ,
	function(event, parameter)
	{
	  alert( "Problem occurred while updating real-time data. The error status code is" +  parameter.httpStatus );
	}
);
FusionWidgets XT provides a feature that correctly prints charts from Firefox, Safari or other Mozilla/WebKit/Gecko based browsers. We call it Managed Printing. This is managed by adding a single line of code in the page :
FusionCharts.printManager.enabled(true);
This feature, when enabled, prepares the charts in the page for printing. Once the chart is prepared, you can print the page with all charts in the page either using File > Print menu of the browser or using code:
FusionCharts.printManager.managedPrint();
The Print Manager internally does the following to achieve this:
- It gathers all aspects of the image data of the present state of the chart
- It converts the image data into image using canvas HTML object
- It hides the canvas image below the chart
- It creates a parallel CSS based print media layout when print is invoked
- It hides the Flash chart and displays the canvas image within this print media layout
- It then sends the layout with the canvas image to the printer for print
Note: Print Manager works only in browsers that supports canvas object.
Print Manager also fires events when it has all the charts ready for managed print. The code below shows how it works:
FusionCharts.addEventListener (
          FusionChartsEvents.PrintReadyStateChange ,
          function (identifier, parameter) {
            if(parameter.ready){
               alert("Chart is now ready for printing.");
               document.getElementById('printButton').disabled = false;
            }
        });
See it live!
Note that PrintReadyStateChange event is a global event. Thus, this event cannot be listened from individual chart instance. Only FusionCharts static class can listen to this event.
The parameters event argument contains a property - ready. This property returns true when the Print Manager is ready to print all charts in a page. Once true is returned by the event, we show a JavaScript alert message-box. The button, which was disabled earlier, is now enabled.
Now you can try printing from File → Print menu. You can also use a button or any function that calls window.print() function.
You can also use the following code to print the whole page using FusionCharts JavaScript Class:
FusionCharts.printManager.managedPrint();
FusionWidgets XT (v3.2) introduces a new and smart drill-down feature - LinkedCharts - that allows you to create unlimited level of drill-down charts using a single data source. All the links originate from a parent chart and its data, which comprehensively contains data or Data URL for all descendant (child, grand-child) charts. Upon clicking the data plot items (funnel, pyramid, etc.) of the parent chart, users can drill-down into descendant charts. The descendant charts (or children charts) can either replace the parent chart with an option to drill-up, or can be opened in new dialogs or frames.
To create LinkedCharts, you need to follow these steps:
- First, create the XML/JSON data for parent chart. This is called the parent data source and comprehensively contains Data String or Data URL for all descendant charts.
- Next, append the Data String or Data URL for all the descendant charts (also called child chart) within the parent data source. If Data String method is used, data for each descendant chart is embedded within the parent data source and linked using unique data identifiers.
- You're done. Yes, no additional code is required!
Click here to know more on LinkedCharts.
Apart from XML, FusionWidgets XT can also accept JSON data format. This functionality is provided by FusionCharts JavaScript class. You can pass chart JSON data in one of the three formats: JSON URL/feed, JSON Object (in JavaScript) or JSON String. The functions that help in accepting JSON data are setJSONUrl, setJSONData, setChartData, setChartDataUrl. Below are some examples of passing JSON data:
Passing JSON data from a URL:
myChart.setJSONUrl("Data.json");
Passing JSON data from a JSON data/JavaScript Object/JSON String embedded in a page:
myChart.setJSONData {
    "chart": {
      "caption" : "Weekly Sales Summary" ,
      "xAxisName" : "Week",
      "yAxisName" : "Sales",
      "numberPrefix" : "$"
    },

    "data" :
      [
        { "label" : "Week 1", "value" : "14400" },
        { "label" : "Week 2", "value" : "19600" },
        { "label" : "Week 3", "value" : "24000" },
        { "label" : "Week 4", "value" : "15700" }
      ]
    }
 );
When running the charts from a local file system, JSON data will not work on certain browsers due to security limitations of AJAX. You will need to run the charts on a server (localhost or remote) to make it work.
Important Note: You cannot use JSON data while using HTML Embedding method.
Starting FusionWidgets XT (v3.2), you can create charts/gauges using jQuery syntax using FusionCharts jQuery plugin. FusionCharts jQuery plugin is the common jQuery plugin for all products of FusionCharts XT Suite. This plugin allows you to render FusionWidgets XT anywhere within a web page, update and retrieve chart data, update cosmetic and functional settings and use all existing features of FusionWidgets XT.
Setting it up:
Setting up of FusionCharts jQuery plugin is as simple as putting an additional reference to the plugin file (FusionCharts.jqueryplugin.js) as shown below:
<script type="text/javascript" src="../Charts/jquery.min.js"></script>
<script type="text/javascript" src="../Charts/FusionCharts.js"></script>
<script type="text/javascript" src="../Charts/FusionCharts.jqueryplugin.js"></script>
- Copy all the/required chart SWF files (from the Download Pack > Charts folder) to your preferred folder
- Copy FusionCharts.js and jquery.min.js from the Download Pack > Charts folder to the preferred folder
- To create JavaScript charts also copy FusionCharts.HC.js and FusionCharts.HC.Widgets.js from the Download Pack > Charts folder to the preferred folder
You do not need to include FusionCharts.HC.js and FusionCharts.HC.Widgets.js in your code. FusionCharts.js will automatically load these files based on requirement.
Now, let's check a few code snippets using FusionCharts jQuery plugin below:
Basic Usage:
The code snippet below shows how to use insertFusionCharts method to render chart in element(s) having id - chartContainer. The parameters passed to this method are same as the parameters passed to FusionCharts JavaScript Class constructor.
$(document).ready(function(){
          $("#chartContainer").insertFusionCharts({
               swfUrl: "Charts/AngularGauge.swf",
               dataSource: "Data.xml",
               dataFormat: "xmlurl",
               width: "400",
               height: "200",
               id: "myChartId"
         });
See it live!
The above code will render a Flash chart. If you wish to render a pure JavaScript chart, you will only need to set the renderer property to javascript. A code snippet is shown below:
$("#chartContainer").insertFusionCharts({
               swfUrl: "Charts/AngularGauge.swf",
               renderer : 'JavaScript',
               width: "400",
               height: "200",
               id: "myChartId",

               dataFormat: "xml",
               dataSource: "<chart lowerLimit='0' upperLimit='100' lowerLimitDisplay='Bad' upperLimitDisplay='Good' numberSuffix='%' showValue='1'> "+
   "<colorRange> "+
      "<color minValue='0' maxValue='75' code='FF654F'/> "+
      "<color minValue='75' maxValue='90' code='F6BD0F'/> "+
      "<color minValue='90' maxValue='100' code='8BBA00'/> "+
   "</colorRange> "+
   "<dials> "+
      "<dial value='92' /> "+
   "</dials> "+
"</chart>"
         });
See it live!
You can also pass JSON as data source as shown below:
$("#chartContainer").insertFusionCharts({
	swfUrl: "Charts/AngularGauge.swf",
	width: "400",
	height: "200",
	id: "myChartId",

	dataFormat: "json",
	dataSource: {
  "chart": {
    "lowerlimit": "0",
    "upperlimit": "100",
    "lowerlimitdisplay": "Bad",
    "upperlimitdisplay": "Good",
    "numbersuffix": "%",
    "showvalue": "1"
  },
  "colorrange": {
    "color": [
      {
        "minvalue": "0",
        "maxvalue": "75",
        "code": "FF654F"
      },
      {
        "minvalue": "75",
        "maxvalue": "90",
        "code": "F6BD0F"
      },
      {
        "minvalue": "90",
        "maxvalue": "100",
        "code": "8BBA00"
      }
    ]
  },
  "dials": {
    "dial": [
      {
        "value": "92"
      }
    ]
  }
}
});
See it live!
If you wish to add a chart to the existing content of an HTML element, without replacing it, you can use the appendFusionCharts method as shown below. This adds a chart at the end of existing content of that element. A code snippet using this method is provided below:
$("#chartContainer").appendFusionCharts({
   swfUrl: "Charts/AngularGauge.swf",
   dataSource: "NextQuarter.xml",
   dataFormat: "xmlurl",
   width: "200",
   height: "100",
   id: "myChartNextID"
});
See it live!
If you wish to add a chart to the beginning of an HTML element, without replacing the existing content, you can use prependFusionCharts method as shown below:
$("#chartContainer").prependFusionCharts({
   swfUrl: "Charts/AngularGauge.swf",
   dataSource: "PreviousQuarter.xml",
   dataFormat: "xmlurl",
   width: "200",
   height: "100",
   id: "myChartPrevID"
});
See it live!
You can also retrieve or update a chart's setting using attrFusionCharts method as shown below:
// Get the latest caption of the chart and show it as alert message
var oldCaption = $("#chartContainer").attrFusionCharts("caption");
	alert("The existing title of the chart is "  + oldCaption);
	// Set a new caption of the chart [ updating a single attribute of the chart ]
	$("#chartContainer").attrFusionCharts("caption": "Updated chart title");
	// Set palette and paletteColors attributes [ updating multiple attributes of the chart ]
	$("#chartContainer").attrFusionCharts({"palette": "5", "paletteColors": "D977B7"});
See these live!
You can also change chart type, update a chart with data or resize charts using updateFusionCharts method as shown below:
Change chart type:
$("#chartContainer").updateFusionCharts({"swfUrl": "../Charts/Thermometer.swf"});
See it live!
Note that changing of chart type is only recommended for charts that use the same data format. When the chart type changes the data is retained internally by FusionCharts jQuery plugin.
Update data:
$("#chartContainer").updateFusionCharts({"dataSource": "new/January.json", "dataFormat": "jsonurl"});
See it live!
Resize chart:
$("#chartContainer").updateFusionCharts({ width : 600, height : 300 });
See it live!
You can clone a chart using cloneFusionCharts method as shown below:
$("#chartContainer").cloneFusionCharts( callbackFnAfterCloning, {width:300, height: 400} );
See it live!
Using :FusionCharts Selector
You can use a custom selector :FusionCharts to find all the charts present in a page. It can be used in the following ways:
- $(":FusionCharts") : This will return a jQuery array containing all the FusionCharts objects on the page
- $("#DashboardContent").find(":FusionCharts") : This will give all the FusionCharts objects (as jQuery array) which are inside the HTML element having id - DashboardContent
See it live!
Event handling:
You can use the jQuery bind method to attach event handlers to FusionCharts specific events. The example below shows how you can bind to DrawComplete event of FusionCharts:
$("#chartContainer").bind( "fusionchartsdrawcomplete", function (e, args) {
   alert("Chart named " + e.sender.id + " has completed chart drawing." );
});
See it live!
Removing chart:
Starting FusionWidgets XT Service Release 2, you can remove a chart using the disposeFusionCharts method as shown below:
$("#chartContainer").disposeFusionCharts();
For more details of setting up and using FusionCharts jQuery plugin, please go through FusionWidgets XT and jQuery section.
FusionCharts jQuery plugin also allows you to configure real-time data of an existing chart. At run-time, you can do the following:
- update real-time chart data
- retrieve chart data
- stop real-time streaming of data
- start real-time streaming of data
- clear the chart data of an existing chart
You can also dynamically update the data value and data label of an existing chart. The streamFusionChartsData() method needs to be used to achieve these.
In the following sections of this page we go through some use-cases to showcase how to use this method.
Using the streamFusionChartsData method you can update the data value or the data label of an existing chart. This method accepts new values for chart as a query string. There are several ways to change the data value or the data label of an existing chart:
A code snippet is shown below:
$("#chartContainer").streamFusionChartsData('&value=66');
In the above code, the HTML elements with id - chartContainer, which contain charts, are selected using the jQuery selector. The streamFusionChartsData method is applied on these elements to find all the FusionCharts objects rendered in the selected elements. A new value is set through value property of the parameter passed to the method. The above code passes the value for one dataset.
You can also opt to update value to multiple datasets. A code snippet is shown below:
$("#chartContainer").streamFusionChartsData('&value=66|44');
In the above code, the value property contains two values '66 and 44' for two datasets. The value 66 corresponds to the first dataset and the value 44 corresponds to the second dataset. The values are separated using a '|' character.
You can also provide multiple values to a dataset. To do so you will have to separate the values using comma(,). A code snippet is show below:
$("#chartContainer").streamFusionChartsData('&value=66,44');
Similarly, you can also update data labels of the existing chart. The code will look as under:
$("#chartContainer").streamFusionChartsData('&label=New Label, &value='66,44');
You can also set multiple labels to the existing chart. To do so you need to separate the labels using comma(,). An example code is shown below:
$("#chartContainer").streamFusionChartsData('&label=Label X, Label Y &value=66,44|22,33', );
You can also pass the parameters sequentially to the method using a command. A code snippet is shown below:
$("#chartContainer").streamFusionChartsData('feed', '40', 'New Label');
In the above code, feed is the command used to update the value and the label of the chart. The value provided is '40' and the label provided is 'New Label'.
Parameters can be passed using an object which contains all the information that is to be passed. A code snippet is shown below:
$("#chartContainer").streamFusionChartsData('feed', {value:'40', label:'New Label'});
Updating data for gauges using setData()
In all the gauges, you can update data using the setData property.
In angular and linear gauges:
To update the data value of a dial/pointer of an angular or linear gauge using setdata command you need to set the index of the dial/pointer first and then mention the value to which you want to update. A code snippet is shown below:
$("#chartContainer").streamFusionChartsData('setdata', '1', '40');
In the above HTML code, setdata is the command used to provide data to the chart. Then the index of the dial/pointer is provided and the value for the corresponding dial/pointer is also provided. Here, the value of the first dial/pointer will be updated. In case you have more than one dial/pointer and you want to update the value of the second dial/pointer you need to provide '2' instead of '1'.
In cylinder, bulb, thermometer and LED gauges:
To update the data value of a cylinder, bulb, thermometer and LED gauges using setdata command you need to set the value. A code snippet is shown below:
$("#chartContainer").streamFusionChartsData('setdata', '40');
In the above HTML code, setdata is the command used to provide data to the chart. Then the value of the gauge is provided.
To update the label of a cylinder, bulb, thermometer and LED gauges using setdata command you need to set the label. A code snippet is shown below:
$("#chartContainer").streamFusionChartsData('setdata', 'New Label');
In the above HTML code, setdata is the command used to provide data to the chart. Then the label of the gauge is provided.
Retrieve data from charts and gauges using getData()
You can retrieve data using the getData property.
In angular and linear gauges:
To retrieve data value of a dial/pointer from an angular or linear gauge using getdata command you need to set the index of the dial/pointer whose value you want to retrieve. A code snippet is shown below:
$("#chartContainer").streamFusionChartsData('getdata', '1');
In the above HTML code, getdata is the command used to retrieve data from the chart. Then the index of the dial/pointer is provided. Here, the value of the first dial/pointer will be retrieved. In case you have more than one dial/pointer and you want to retrieve the value of the second dial/pointer you need to provide '2' instead of '1'.
In cylinder, bulb, thermometer and LED gauges:
To retrieve the data value of a cylinder, bulb, thermometer and LED gauges you need to use the getData command. A code snippet is shown below:
$("#chartContainer").streamFusionChartsData('getdata');
In the above HTML code, getdata is the command used to retrieve data from the chart. No other parameters are required.
To stop updating real-time data streaming you need to use the stop command. A code snippet is given below:
$("#chartContainer").streamFusionChartsData('stop');
In the above code, the stop command is used to stop the real-time data streaming.
To start/restart updating real-time data streaming you need to use the start command. A code snippet is given below:
$("#chartContainer").streamFusionChartsData('start');
In the above code, the start command is used to start/restart the real-time data streaming.
To clear the existing data of the chart you need to use the clear command. A code snippet is given below:
$("#chartContainer").streamFusionChartsData('clear');
In the above code, the clear command is used to clear the real-time data of the chart.
Note: This command is applicable only for Real-time Area, Real-time Column, Real-time Line, Real-time Stacked Area, Real-time Stacked Column and Real-time Line (Dual Y) charts.
By default, the real-time Flash charts and gauges, before updating real-time data, wait for a few seconds after the first render. To allow the chart to start updating itself as soon as it is rendered, set:
Prior to FusionWidgets XT, you were required to define realTimeValuePadding, xAxisNamePadding or legendPadding attributes to avoid overlapping of the x-axis labels and the real-time values/x-axis name/legend. Starting FusionWidgets XT, you are not required to do so. If you were using any of these attributes to avoid overlapping, you can remove them from your XML as the updated charts will take care of this automatically.
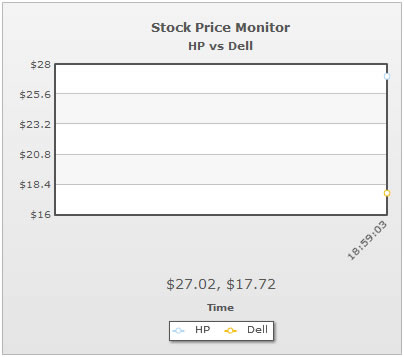
Starting FusionWidgets XT, real-time charts automatically try to avoid overlapping of the incremental x-axis labels and the real-time values. A chart with an empty canvas (i.e., no historical data) automatically adds a padding between the canvas and the real-time values based on the vertical space occupied by the first updated x-axis label. This helps in avoiding overlapping of the x-axis labels and the real-time values as shown in the images below:
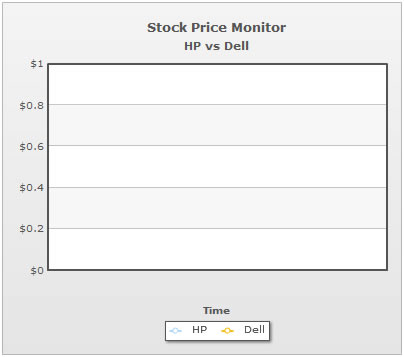 |
 |
| Chart with an empty canvas (i.e., no historical data). There is an empty space between the canvas and the x-axis name "Time" to accommodate the real-time values. |
Chart with the first update.
The chart automatically adds vertical space between the canvas and the real-time values to further accommodate the x-axis labels and avoid overlapping. |
If you further want to add more vertical space between the x-axis labels and the real-time values, you can use the realTimeValuePadding attribute as shown below:
<chart ... realTimeValuePadding='20' ...>
{
  "chart" : {
  "realTimeValuePadding" : "20",
  ...
  }'
  }
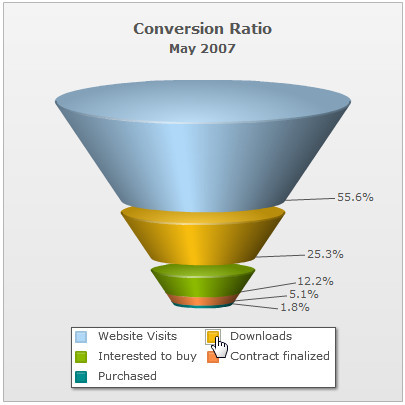
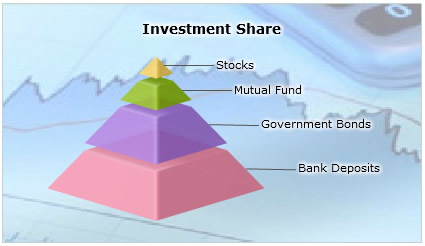
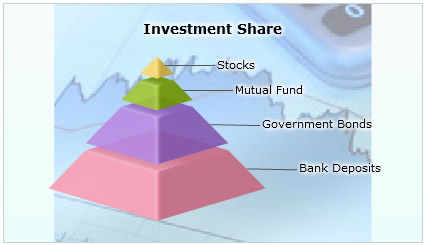
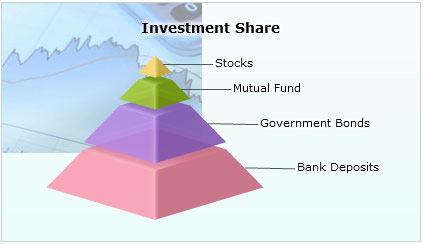
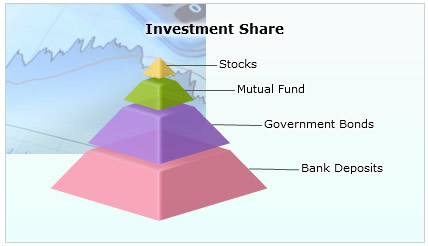
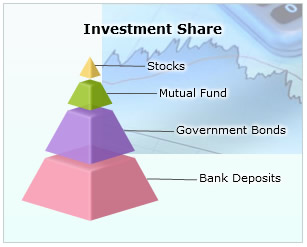
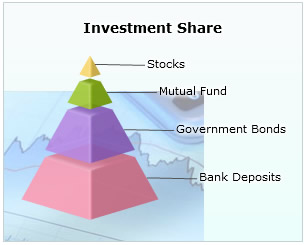
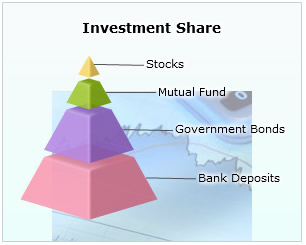
Starting FusionWidgets XT, you can choose to place the labels in separate legend box for Funnel and Pyramid charts. You can click on the legend items to slice in and slice-out the respective funnel/pyramid item as shown below:
 |
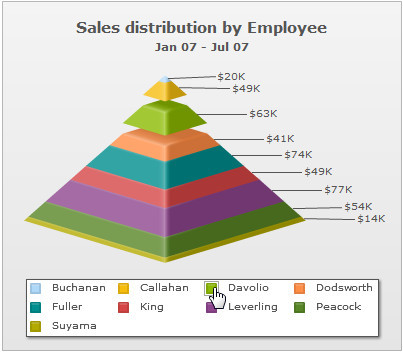 |
To show the legend (and hide the labels beside the pyramid) set:
<chart .. showLegend='1' showLabels='0'...>
{ "chart" : {... "showlegend" : "1", "showlabels": "0" ... } }
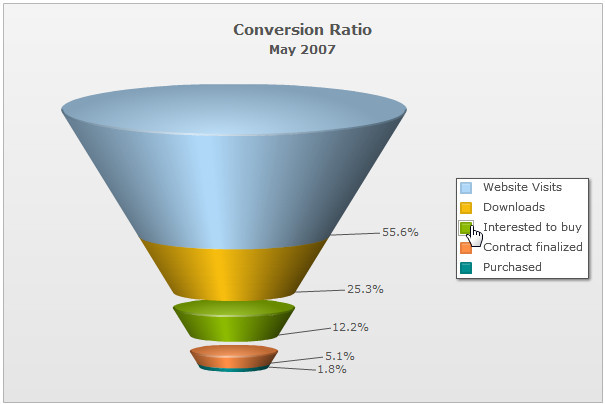
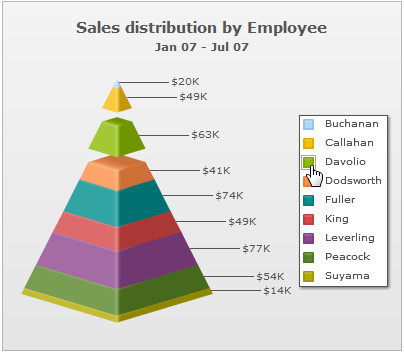
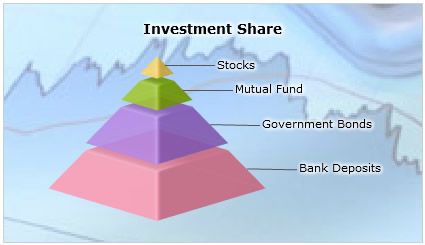
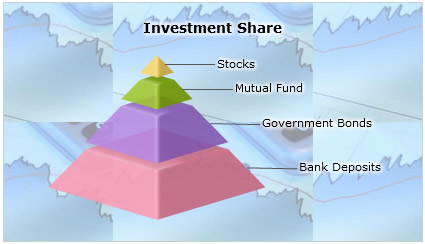
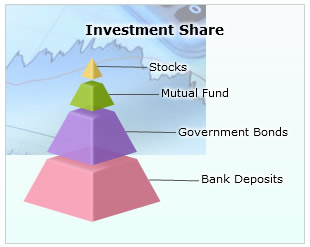
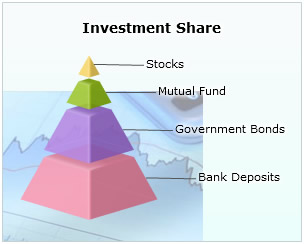
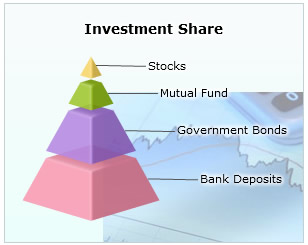
You can also place the legend at the right by setting the value of the legendPosition attribute to RIGHT:
<chart .. showLegend='1' legendPosition='RIGHT' showLabels='0'...>
{ "chart" : {... "showlegend" : "1", "legendposition": "RIGHT", "showlabels": "0" ... } }
The legend will be placed on the right as shown below:
 |
 |
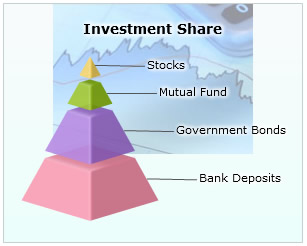
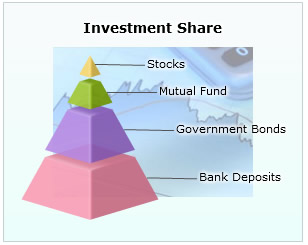
It is now possible to display chart's background images using stretch, tile, center etc. display modes. To apply a display mode to the background image, you need to use bgImageDisplayMode attribute in <chart> element. For example:
 |
| Stretch - Expands the image to fit the entire chart area, without maintaining original image constraints |
 |
| Fit - Fits the image proportionately on the chart area |
 |
| Fill -Proportionately fills the entire chart area with the image |
 |
| Tile - The image is repeated as a pattern on the entire chart area |
 |
| Center - The image is positioned at the center of the chart area |
 |
| none - the original image is placed at the top left corner of the chart background (default) |
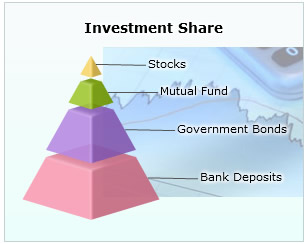
It is now possible to configure the vertical and horizontal alignment of chart's background image. The attributes used to apply the alignments are bgImageVAlign (possible values are - top, middle and bottom) and bgImageHAlign (possible values are left, middle and right) in the <chart> element.
 |
 |
 |
| bgImageVAlign='top' bgImageHAlign='left' |
bgImageVAlign='top' bgImageHAlign='middle' |
bgImageVAlign='top' bgImageHAlign='right' |
 |
 |
 |
| bgImageVAlign='middle' bgImageHAlign='left' |
bgImageVAlign='middle' bgImageHAlign='middle' |
bgImageVAlign='middle' bgImageHAlign='right' |
 |
 |
 |
| bgImageVAlign='bottom' bgImageHAlign='left' |
bgImageVAlign='bottom' bgImageHAlign='middle' |
bgImageVAlign='bottom' bgImageHAlign='right' |
Starting FusionWidgets XT, the default font size for caption and sub caption has been increased. Hence, you are no more required to apply font Styles to increase the size of the caption or sub caption of a chart. The default font size for caption is 13 pixels and the default font size for the sub caption is 11 pixels.
It is now possible to set alignment of the chart caption and the sub caption with respect to the chart canvas. You can achieve this using the align attribute in Font style definition. This attribute is only applicable to CAPTION and SUBCAPTION objects of the chart. Let us see an example which aligns the caption to the left and the sub caption to the right.
<styles>
  <definition>
    <style name='LeftAlignCaption' type='font' align='left'/>
    <style name='RightAlignSubCaption' type='font' align='right'/>
  </definition>
  <application>
    <apply toObject='CAPTION' styles='LeftAlignCaption' />
    <apply toObject='SUBCAPTION' styles='RightAlignSubCaption' />
  </application>
</styles>
{
 ...
 "styles": {
    "definition": [
      {
        "name": "LeftAlignCaption",
        "type": "font",
        "align": "left"
      },
      {
        "name": "RightAlignSubCaption",
        "type": "font",
        "align": "right"
      }
    ],
    "application": [
      {
        "toobject": "CAPTION",
        "styles": "LeftAlignCaption"
      },
      {
        "toobject": "SUBCAPTION",
        "styles": "RightAlignSubCaption"
      }
    ]
  }
}
Controlling alignment of caption and sub-caption is not supported in JavaScript charts.
Now it is possible to set a minimum value of the Y-Axis of all the stacked charts. For all single Y Axis charts yAxisMinValue attribute is used to set this.
This section is dedicated to those, who are upgrading to FusionWidgets XT from versions earlier to v3.1.
Making use of % sizing (initial)
Starting FusionWidgets v3.1, you can now specify your chart's width and height in percentage (during initialization only). This sets the chart size with respect to the parent container that contains it. Please note that dynamic sizing with respect to browser is still not possible i.e., if you resize your browser, the charts will NOT resize accordingly.
NOTE: However, starting FusionWidgets XT (v3.2), charts can resize according to the changed size of the browser of the container of the chart. To know more, please read Dynamically resizable gauges and charts.
Using Rotated fonts
If you are using FusionWidgets in your Flash movies and using rotated fonts by embedding the fonts, you can now remove those embedded fonts. FusionWidgets v3.1 and above now displays rotated text without need for embedded fonts.
This section is dedicated to those, who are upgrading to FusionWidgets XT from FusionWidgets v3.0.7.
All the features of FusionWidgets v3.1 and above are backward compatible with FusionWidgets v3.0.7, barring one - exporting charts as images/PDFs. So, if you're not using "Export as image" feature currently, you can just over-write your old chart SWF files with the new ones and the process is complete. However, if you do use the "Export as image" functionality and wish to use the new features of v3.1 and above, please follow the steps below:
- Update your chart SWF files with the new v3.1 SWF files
- Update your server-side image-saving scripts with the new FusionCharts Export Handlers (server-side image saving scripts).
- Configure the parameters in the chart XML, also specify the temporary folder path in server side FusionCharts Export Handlers. Do this only if you intend to save the charts on server.
- Change the parameter in the chart XML again if you want to use a different export format for the image
If you intend to use the new client-side FusionCharts Export Component, please follow the instructions in the section "Exporting as Image/PDF"