<chart caption="Yearly Sales" xAxisName="Year" yAxisName="Sales"> <set label="2004" value="37800" link="newchart-xmlurl-Data2004.xml" /> <set label="2005" value="21900" link="newchart-xmlurl-Data2005.xml" /> <set label="2006" value="32900" link="newchart-xmlurl-Data2006.xml" /> <set label="2007" value="39800" link="newchart-xmlurl-Data2007.xml" /> </chart>
LinkedCharts is a new and smart drill-down feature introduced in FusionWidgets XT that allows you to create unlimited level of drill-down charts using a single data source. All the links originate from a parent chart and it's data, which comprehensively contains data or Data URL for all descendant (child, grand-child) charts. Upon clicking the data plot items (pyramid, funnel etc.) of the parent chart, users can drill-down into descendant charts. The descendant charts (or children charts) can either replace the parent chart with an option to drill-up, or can be opened in new dialogs or frames.
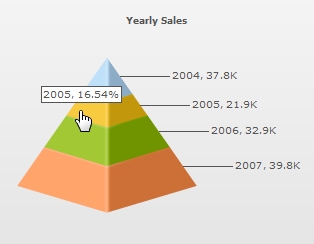
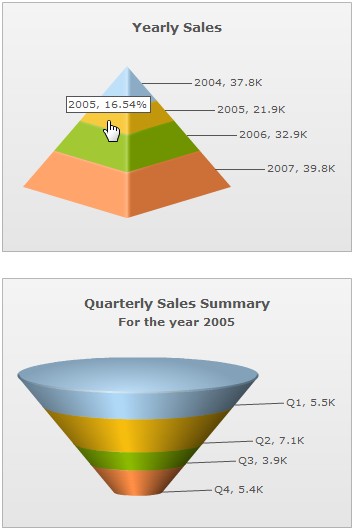
Let's consider a simple scenario with a single level of drill-down. We will build a parent chart that shows yearly sales, which when clicked will show quarterly sales for that year. Let's build the parent chart as a Pyramid chart with four slices (representing four years). LinkedCharts allows you to build these kinds of scenarios (and much more complex) without having to write any additional line of code.
To use LinkedCharts, you need to follow these steps:
- First, create the XML/JSON data for parent chart. This is called the parent data source and comprehensively contains Data String or Data URL for all descendant charts.
- Next, append the Data String or Data URL for all the descendant charts (also called child chart) within the parent data source. If Data String method is used, data for each descendant chart is embedded within the parent data source and linked using unique data identifiers.
- You're done. Yes, no additional code is required!
The LinkedChart feature of FusionCharts JavaScript Class will take care of the rest.
FusionWidgets XT uses FusionCharts JavaScript Class that takes care of all the products of FusionCharts XT Suite including FusionWidgets XT.
It does the following:
- Automatically creates and shows a detailed child chart when a data plot item link » (specially defined links using newchart prefix) in the parent chart is clicked
- Clones all chart configuration settings from the parent chart to create the child chart or the LinkedChart
- Allows you to configure specific properties for the descendant charts » e.g., type of chart, width, height, where the charts will be shown etc. using configureLink() function
- Notifies your code by way of events when a link is invoked, when link item is opened and when link item is closed
- Allows you to drill-down to unlimited numbers of levels
The images below shows how a simple LinkedCharts implementation works (here, we've shown only 1 level of drill-down):
 |
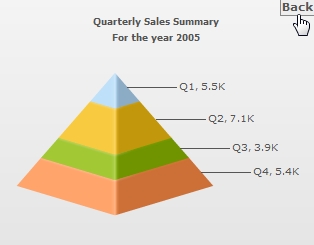 |
| Main chart with four year's sales data. Pyramid of year 2005 is being clicked. |
LinkedChart with data of 2005 replaces the main chart. Click on Back overlay button to return to the main chart. |
See it live!
In this page we will learn how LinkedCharts work with the items listed below:
- Create a basic LinkedChart which loads descendant (child) charts replacing the parent chart. The data of the child charts come from Data URL.
- Create LinkedCharts with data for all descendant charts embedded inside the parent chart data source
- Configure various aspects of LinkedCharts. Here, we will change the chart type of the descendant charts
- Open descendant charts in a separate HTML container
- Listen to events
- Open descendant charts inside jQuery dialog
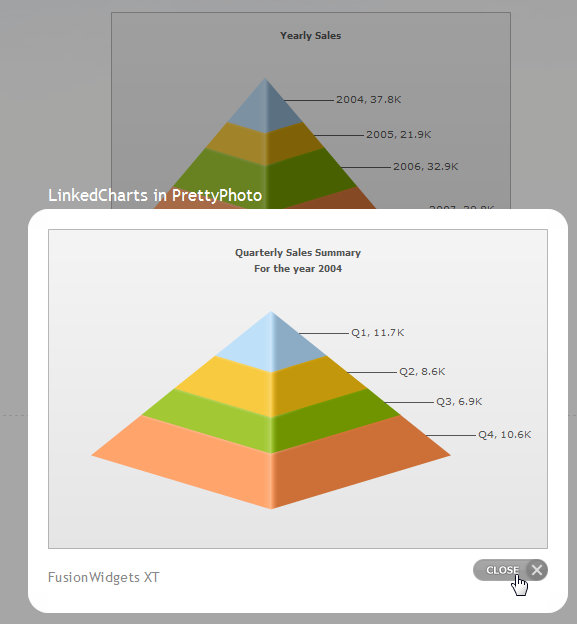
- Open descendant charts inside jQuery PrettyPhoto
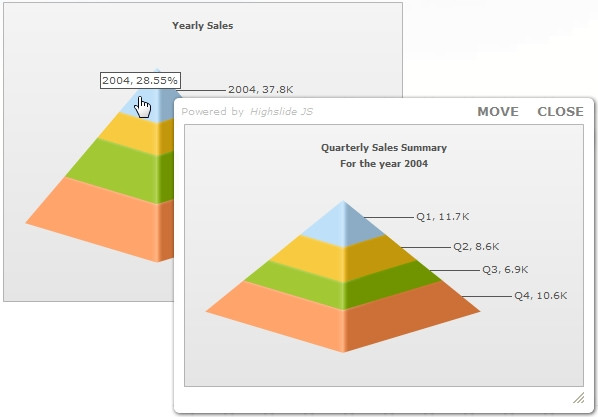
- Open descendant charts inside HighSlide lightbox
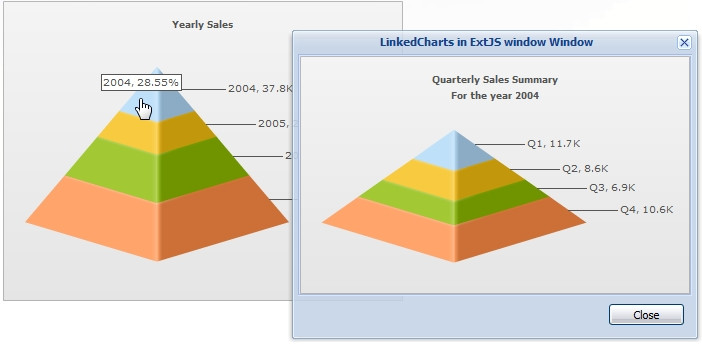
- Open descendant charts inside ExtJS window
While it was possible to create drill-down charts using FusionWidgets v3.1 (or previous versions) as well, you had to write additional code and handlers to make this possible. LinkedCharts helps you attain the same without an additional line of code.
Let's now find out how this is implemented in the code shown below:
HTML
For a very basic implementation the HTML is exactly same as our first chart, weekly-sales which we created in Creating your first chart section. The HTML is as follows:
<html>
  <head>
    <title>My First chart using FusionCharts</title>
    <script type="text/javascript" src="Charts/FusionCharts.js">
    </script>
  </head>
  <body>
    <div id="chartContainer">Chart will load here!</div>
    <script type="text/javascript"><!--

      var myChart = new FusionCharts( "Charts/Pyramid.swf",
        "myChartId", "320", "250", "0", "1" );
      myChart.setXMLUrl("summary-data.xml");
      myChart.render("chartContainer");

    // -->
    </script>
  </body>
</html
In the above HTML we have created only the parent chart. The chart takes data from an xml file, summary-data.xml. This chart, in junction with LinkedCharts functionality defined in FusionCharts.js, will drive drill-down charts; without you having to write any additional line of code.
XML Data
The XML data is what drives the entire LinkedCharts drill-down functionality. In this example, we will use Data URL method to specify URL of descendant charts. In context of XML data, it is called XML URL method. Given below is the XML data specifying LinkedChart for each column.
{
  "chart":{
    "caption":"Yearly Sales",
    "xaxisname":"Year",
    "yaxisname":"Sales"
  },
  "data":[{
      "label":"2004",
      "value":"37800",
      "link":"newchart-xmlurl-Data2004.xml"
    },
    {
      "label":"2005",
      "value":"21900",
      "link":"newchart-xmlurl-Data2005.xml"
    },
    {
      "label":"2006",
      "value":"32900",
      "link":"newchart-xmlurl-Data2006.xml"
    },
    {
      "label":"2007",
      "value":"39800",
      "link":"newchart-xmlurl-Data2007.xml"
    }
  ]
}
In the above XML we define link attribute of each <set> element. Note how link for each slice is defined as newchart-xmlurl-DataURL. newChart prefix is used to indicate that it must invoke LinkedChart. xmlURL indicates that XML URL method is used to specify data for linked chart; in case of JSON data, jsonurl is used. URL specifies the data path for the linked chart that opens when this slice is clicked.
Note: You can create LinkedCharts using the link attribute of a data plot or the clickURL atttribute of the chart or gauge.
As per the above XML, the data for the child chart which loads when first slice is clicked, is Data2004.xml; Data2005.xml when the second slice is clicked etc. Hence, for 4 slices in this sample there are 4 separate XML files from which the data for the detailed charts will be used. The four XML (and JSON) files are as follows:
<chart caption="Quarterly Sales Summary" subcaption="For the year 2004" xAxisName="Quarter" yAxisName="Sales" >
    <set label="Q1" value="11700" />
    <set label="Q2" value="8600" />
    <set label="Q3" value="6900" />
    <set label="Q4" value="10600" />
</chart>
<chart caption="Quarterly Sales Summary" subcaption="For the year 2005" xAxisName="Quarter" yAxisName="Sales">
    <set label="Q1" value="5500" />
    <set label="Q2" value="7100" />
    <set label="Q3" value="3900" />
    <set label="Q4" value="5400" />
</chart>
<chart caption="Quarterly Sales Summary" subcaption="For the year 2006" xAxisName="Quarter" yAxisName="Sales">
    <set label="Q1" value="6700" />
    <set label="Q2" value="9200" />
    <set label="Q3" value="10800" />
    <set label="Q4" value="6200" />
</chart>
<chart caption="Quarterly Sales Summary" subcaption="For the year 2007" xAxisName="Quarter" yAxisName="Sales">
    <set label="Q1" value="8900" />
    <set label="Q2" value="6600" />
    <set label="Q3" value="11200" />
    <set label="Q4" value="13100" />
</chart>
{
  {
  "chart":{
    "caption":"Quarterly Sales Summary",
    "subcaption":"For the year 2004",
    "xaxisname":"Quarter",
    "yaxisname":"Sales"
  },
  "data":[{
      "label":"Q1",
      "value":"11700"
    },
    {
      "label":"Q2",
      "value":"8600"
    },
    {
      "label":"Q3",
      "value":"6900"
    },
    {
      "label":"Q4",
      "value":"10600"
    }
  ]
}
{
  &{
  "chart":{
    "caption":"Quarterly Sales Summary",
    "subcaption":"For the year 2005",
    "xaxisname":"Quarter",
    "yaxisname":"Sales"
  },
  "data":[{
      "label":"Q1",
      "value":"5500"
    },
    {
      "label":"Q2",
      "value":"7100"
    },
    {
      "label":"Q3",
      "value":"3900"
    },
    {
      "label":"Q4",
      "value":"5400"
    }
  ]
}
{
  {
  "chart":{
    "caption":"Quarterly Sales Summary",
    "subcaption":"For the year 2006",
    "xaxisname":"Quarter",
    "yaxisname":"Sales"
  },
  "data":[{
      "label":"Q1",
      "value":"6700"
    },
    {
      "label":"Q2",
      "value":"9200"
    },
    {
      "label":"Q3",
      "value":"10800"
    },
    {
      "label":"Q4",
      "value":"6200"
    }
  ]
}
{
  {
  "chart":{
    "caption":"Quarterly Sales Summary",
    "subcaption":"For the year 2007",
    "xaxisname":"Quarter",
    "yaxisname":"Sales"
  },
  "data":[{
      "label":"Q1",
      "value":"8900"
    },
    {
      "label":"Q2",
      "value":"6600"
    },
    {
      "label":"Q3",
      "value":"11200"
    },
    {
      "label":"Q4",
      "value":"13100"
    }
  ]
}
The page first loads the parent chart, a pyramid chart with 4 years data. When a pyramid slice (year) is clicked the parent chart is replaced by a detailed child chart showing quarterly data for that particular year. There is a Back overlay button at the top right corner of the chart. This button when clicked leads us back to the main chart.
This is a very basic sample in which the parent chart is replaced by the child chart. However, there are a lot of things that you can configure, like the links from JavaScript (using configureLink function) such that the descendant charts get appended to the parent chart's container. You can also make the descendant charts open in a separate container. Using event listeners you can even extend the functionality to open the descendant charts in jQuery dialogs, light-boxes etc. You can also modify various aspects (like size, attribute etc.) of the parent chart as well as the opening descendant chart. Possibilities are endless. We explore some of the possibilities in the coming sections of this page.
A few points on the XML's link attribute to implement LinkedCharts :
The format of the link attribute's value is : "newchart-dataformat-datasource". Here, newchart- is a constant. The values for dataformat and datasource are as follows:
- dataformat » ( i.e., value after newchart prefix and a hyphen (-) ) is the format in which data for the linked chart is provided. Data format can be of 4 types:
- xmlurl - This defines that the data for the new chart will come from an XML URL. This is automatically loaded by the linked chart.
- jsonurl - This defines that the data for the new chart will come from a JSON URL. This is automatically loaded by the linked chart
- xml - This defines that the data for the new chart will come from XML embedded inside the XML for the parent chart (parent data source)
- json - This defines that the data for the new chart will come from JSON embedded inside the JSON for the parent chart (parent data source)
- datasource » (the rest of the value, after a hyphen (-) again) defines the value for data source (either URL or Data String itself) for the descendant chart as per the dataformat set:
- When xmlurl is set as the dataformat, the datasource value will be a URL of the XML file
- When jsonurl is set as the dataformat, the datasource value will be a URL of the JSON file
- When xml is set as the dataformat, the datasource assumes value of the unique data identifier which refers to data embedded inside <linkeddata> node (that contains data for all descendant charts) in the parent data source for the descendant chart
- When json is set as the dataformat, the datasource assumes value of the unique data identifier which refers to data embedded inside the Array linkeddata (that contains data for all descendant charts) in the parent data source for the descendant chart
For detailed information of the XML/JSON structure of the LinkedCharts' data read Drill-Down Charts > LinkedCharts > XML Format and JSON Format pages.
You can embed the descendant Data String in the parent data source. This is called Data String method in context of LinkedCharts. Each data plot item in parent chart is then linked to a descendant chart data (embedded in parent data source) by means of a unique data identifier. A sample XML and equivalent JSON is given below:
<chart caption="Yearly sales" xAxisName="Year" yAxisName="Sales">
  <set label="2004" value="37800" link="newchart-xml-2004-quarterly" />
  <set label="2005" value="21900" link="newchart-xml-2005-quarterly" />
  <set label="2006" value="32900" link="newchart-xml-2006-quarterly" />
  <set label="2007" value="39800" link="newchart-xml-2007-quarterly" />

  <linkeddata id="2004-quarterly">
    <chart caption="Quarterly Sales Summary" subcaption="For the year 2004" xAxisName="Quarter" yAxisName="Sales" >
      <set label="Q1" value="11700" />
      <set label="Q2" value="8600" />
      <set label="Q3" value="6900" />
      <set label="Q4" value="10600" />
    </chart>
  </linkeddata>

  <linkeddata id="2005-quarterly">
    <chart caption="Quarterly Sales Summary" subcaption="For the year 2005" xAxisName="Quarter" yAxisName="Sales">
      <set label="Q1" value="5500" />
      <set label="Q2" value="7100" />
      <set label="Q3" value="3900" />
      <set label="Q4" value="5400" />
    </chart>
  </linkeddata>

  <linkeddata id="2006-quarterly">
    <chart caption="Quarterly Sales Summary" subcaption="For the year 2006" xAxisName="Quarter" yAxisName="Sales">
      <set label="Q1" value="6700" />
      <set label="Q2" value="9200" />
      <set label="Q3" value="10800" />
      <set label="Q4" value="6200" />
    </chart>
  </linkeddata>

  <linkeddata id="2007-quarterly">
    <chart caption="Quarterly Sales Summary" subcaption="For the year 2007" xAxisName="Quarter" yAxisName="Sales">
      <set label="Q1" value="8900" />
      <set label="Q2" value="6600" />
      <set label="Q3" value="11200" />
      <set label="Q4" value="13100" />
    </chart>
  </linkeddata>

</chart>
{
  {
  "chart":{
    "caption":"Yearly sales",
    "xaxisname":"Year",
    "yaxisname":"Sales"
  },
  "data":[{
      "label":"2004",
      "value":"37800",
      "link":"newchart-xml-2004-quarterly"
    },
    {
      "label":"2005",
      "value":"21900",
      "link":"newchart-xml-2005-quarterly"
    },
    {
      "label":"2006",
      "value":"32900",
      "link":"newchart-xml-2006-quarterly"
    },
    {
      "label":"2007",
      "value":"39800",
      "link":"newchart-xml-2007-quarterly"
    }
  ],
  "linkeddata":[{
      "id":"2004-quarterly",
      "linkedchart":{
        "chart":{
          "caption":"Quarterly Sales Summary",
          "subcaption":"For the year 2004",
          "xaxisname":"Quarter",
          "yaxisname":"Sales"
        },
        "data":[{
            "label":"Q1",
            "value":"11700"
          },
          {
            "label":"Q2",
            "value":"8600"
          },
          {
            "label":"Q3",
            "value":"6900"
          },
          {
            "label":"Q4",
            "value":"10600"
          }
        ]
      }
    },
    {
      "id":"2005-quarterly",
      "linkedchart":{
        "chart":{
          "caption":"Quarterly Sales Summary",
          "subcaption":"For the year 2005",
          "xaxisname":"Quarter",
          "yaxisname":"Sales"
        },
        "data":[{
            "label":"Q1",
            "value":"5500"
          },
          {
            "label":"Q2",
            "value":"7100"
          },
          {
            "label":"Q3",
            "value":"3900"
          },
          {
            "label":"Q4",
            "value":"5400"
          }
        ]
      }
    },
    {
      "id":"2006-quarterly",
      "linkedchart":{
        "chart":{
          "caption":"Quarterly Sales Summary",
          "subcaption":"For the year 2006",
          "xaxisname":"Quarter",
          "yaxisname":"Sales"
        },
        "data":[{
            "label":"Q1",
            "value":"6700"
          },
          {
            "label":"Q2",
            "value":"9200"
          },
          {
            "label":"Q3",
            "value":"10800"
          },
          {
            "label":"Q4",
            "value":"6200"
          }
        ]
      }
    },
    {
      "id":"2007-quarterly",
      "linkedchart":{
        "chart":{
          "caption":"Quarterly Sales Summary",
          "subcaption":"For the year 2007",
          "xaxisname":"Quarter",
          "yaxisname":"Sales"
        },
        "data":[{
            "label":"Q1",
            "value":"8900"
          },
          {
            "label":"Q2",
            "value":"6600"
          },
          {
            "label":"Q3",
            "value":"11200"
          },
          {
            "label":"Q4",
            "value":"13100"
          }
        ]
      }
    }
  ]
}
See it live!
For detailed information of the XML/JSON structure of the LinkedCharts' data read Drill-Down Charts > LinkedCharts > XML Format and JSON Format pages.
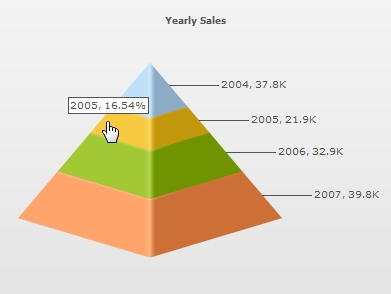
Till now, we've seen how to use the standard LinkedCharts feature provided by FusionCharts. Here, the descendant charts used the same configuration and chart type as the parent chart. However, FusionCharts JavaScript Class allows you to configure each aspect of the descendant charts LinkedCharts using the function configureLink() for each chart instance. Using this function, you can pass all your desired configurations for the descendant charts.
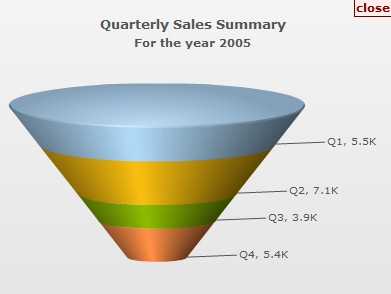
You can pass all the properties that a FusionCharts constructor accepts. Additionally, you can also configure the overlay button using overlayButton property. In the sample JavaScript code given below we will change the chart type of the child charts to Funnel and set custom colors for overlay-buttons. Note that for this example we will use the same data files that we have used in our basic LinkedChart sample above. Only, we have set the streamlinedData to 0 in the Funnel data.
The images below shows how it works:
 |
 |
| Main chart with four year's sales data |
LinkedChart as Funnel and with customized overlay button |
See it live!
var myChart = new FusionCharts( "Charts/Pyramid.swf",
    "myChartId", "320", "250", "0", "1" );
  myChart.setXMLUrl("summary-data.xml");
  myChart.render("chartContainer");

  FusionCharts("myChartId").configureLink (
  {
    swfUrl : "../../../../Charts/Funnel.swf",
    overlayButton:
    {
      message: 'close',
      fontColor : '880000',
      bgColor:'FFEEEE',
      borderColor: '660000'
    }
  }, 0 );
In the above code we've done the following:
- Created a parent chart with ID myChartId. We've provided it in the XML data that we had built earlier.
- Called configureLink function to configure the descendant charts
- Passed an Object containing the various drill-down properties as the first parameter of the configureLink function. The properties are:
- swfUrl: with its value as the path to Funnel.swf. This helps in configuring the descendant charts to show a Funnel.
- overlayButton: an Object with various configurations for overlay button
- Passed the drill-down level to configure as the second parameter of the configureLink function. Zero denotes the first level of drill-down.
Note that you can pass all the properties that a FusionCharts constructor accepts as the property of the parameter of the configureLink function. To know the properties for overlayButton read overlayButton property list.
Now let's modify the above code and the HTML a bit so that we can render the descendant charts in a separate HTML container. This will help us retain the parent chart as well as show the child charts separately. The changes are as follows:
In the HTML we added a new DIV with "linkedchart-container" as id just below the existing chart container DIV. This new DIV will be the container for the LinkedCharts.
<div id="chartContainer">Parent chart will load here</div>

<div id="linkedchart-container" >LinkedCharts will load here</div>
FusionCharts("myChartId").configureLink (
  {
    swfUrl : "../../../../Charts/Funnel.swf",
    "renderAt" : "linkedchart-container",
    overlayButton: { show : false }
  });
In JavaScript's configureLink function we do a bit of modifications as described below:
- We add renderAt property and set the value to "linkedchart-container" where the LinkedCharts will be generated
- We set the overlay button off by setting the show property to false
Once run, the functionality will work somehow like the image shown below:
See it live!
FusionCharts JavaScript Class raises a number of events when LinkedCharts are in action. Each link-invoking chart instance (i.e., the parent chart) can listen to the events and can add more functionality to the implementation. The events are as follows:
- BeforeLinkedItemOpen : Fires before a LinkedChart item (descendant chart) is created
- LinkedItemOpened : Fires after a LinkedChart item or descendant chart is created
- BeforeLinkItemClose : Fires before a LinkedChart item or descendant chart is closed
- LinkedItemClosed : Fires after a LinkedChart item or descendant chart is closed
The events can be listened using addEventListener on the link invoking chart/master chart. You can also trap the events globally for all charts. For this you need to use the FusionCharts.addEventListener() static function. For details on each event read Events page. For basic implementation example of events read Listening to events page.
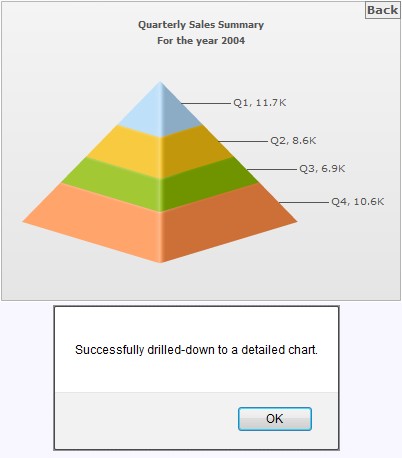
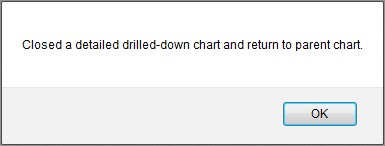
Here, we will create a small example which listens to LinkItemOpened and LinkItemClosed events and shows alert message when each event fires. The images shown below are what the code below instructs:
See it live!
var myChart = new FusionCharts( "../../../../Charts/Pyramid.swf",
    "myChartId", "320", "240", "0", "1" );
  myChart.setJSONUrl("summary-data.xml");
  myChart.render("chartContainer");

  FusionCharts("myChartId").addEventListener(
    "LinkedItemOpened", function (eo, ao) {
	   alert( 'Successfully drilled-down to a detailed chart.');
    }
  );
  FusionCharts("myChartId").addEventListener(
    "LinkedItemClosed", function (eo, ao) {
	   alert( 'Closed a detailed drilled-down chart and return to parent chart.');
	 }
  );
In the above code, we have done the following:
- Used addEventListener function to listen to the two events - LinkItemOpened and LinkItemClosed
- Declared anonymous function for each event listener (each function displays pertinent message)
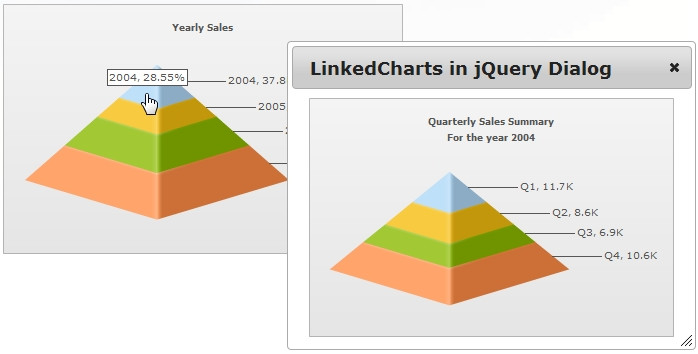
You can render the LinkedCharts in a jQuery dialog. A live implementation of this will resemble the image below:
Watch it live!
<html>
  <head>
    <script type="text/javascript" src="../../../../Charts/FusionCharts.js"></script>

    <link href="resources/jquery.ui/jquery-ui.css" rel="stylesheet" type="text/css" />
    <script src="resources/jquery.ui/jquery.min.js" type="text/javascript"></script>
    <script src="resources/jquery.ui/jquery-ui.min.js" type="text/javascript"></script>

    <script type="text/javascript"><!--

        var dialog;

        $(document).ready(function() {

          dialog = $('#linkedchart-container').dialog({
            autoOpen: false,
            width: 550,
            height: 320,
            title : 'LinkedCharts in jQuery Dialog'
          });
        });
    // --></script>

  </head>

  <body>
      <div id="chartContainer">Parent chart will load here</div>
      <div id="linkedchart-container">LinkedCharts will load here</div>
      <script type="text/javascript"><!--

        var myChart = new FusionCharts( "../../../../Charts/Pyramid.swf",
          "myChartId", "400", "300", "0", "1" );
        myChart.setXMLUrl("summary-data.xml");
        myChart.render("chartContainer");

       FusionCharts("myChartId").configureLink
       (
         {
           width : '100%',
           height: '100%',
           id: 'linked-chart',
           renderAt : "linkedchart-container",
           overlayButton: { show : false }
          },0
       );

       FusionCharts("myChartId").addEventListener('BeforeLinkedItemOpen',
         function() {
           dialog.dialog('open');
          }
        );


    // --></script>

  </body>
</html>
In order to render the link charts in a jQuery dialog, you do not have to make any changes to the XML. For the above example we have used the same XML as discussed previously in this page.
Through the above code, we do the following:
- Include the jQuery UI library files
<link href="resources/jquery.ui/jquery-ui.css" rel="stylesheet" type="text/css" />
<script src="resources/jquery.ui/jquery.min.js" type="text/javascript"></script>
<script src="resources/jquery.ui/jquery-ui.min.js" type="text/javascript"></script>
<script type="text/javascript" src="../../../../Charts/FusionCharts.js"></script>
<div id="chartContainer">Parent chart will load here</div>
<div id="linkedchart-container">LinkedCharts will load here</div>
dialog = $('#linkedchart-container').dialog({
  autoOpen: false,
  width: 550,
  height: 320,
  title : 'LinkedCharts in jQuery Dialog'
}); var myChart = new FusionCharts( "../../../../Charts/Pyramid.swf",
"myChartId", "400", "300", "0", "1" );
myChart.setXMLUrl("summary-data.xml");
myChart.render("chartContainer");
FusionCharts("myChartId").configureLink(
{
width : '100%',
height: '100%',
id: 'linked-chart',
renderAt : "linkedchart-container",
overlayButton: { show : false }
},0
);
FusionCharts("myChartId").addEventListener('BeforeLinkedItemOpen',
function() {
dialog.dialog('open');
}
);
Watch it live!
<html>
<head>
<script type="text/javascript" src="../../../../Charts/FusionCharts.js"></script>
<link href="resources/jquery.ui/jquery-ui.css" rel="stylesheet" type="text/css" />
<script src="resources/jquery.ui/jquery.min.js" type="text/javascript" ></script>
<script src="resources/jquery.ui/jquery-ui.min.js" type="text/javascript" ></script>
<link rel="stylesheet" href="resources/prettyPhoto/css/prettyPhoto.css" type="text/css" media="screen" charset="utf-8" />
<script src="resources/prettyPhoto/js/jquery.prettyPhoto.js" type="text/javascript" charset="utf-8"></script>
<style type="text/css">
#prettyphoto-container {
display: none;
height: 320px;
width: 550px;
}
</style>
<script type="text/javascript"><!--
$(document).ready(function() {
$('#linkedchart-container').prettyPhoto( {
opacity: 0.35,
showTitle: true,
allowresize: true
});
});
// --></script>
</head>
<body>
<div id="chartContainer">Parent chart will load here</div>
<div id="prettyphoto-container">
<div id="linkedchart-container" ></div>
</div>
<script type="text/javascript"><!--
var myChart = new FusionCharts( "../../../../Charts/Pyramid.swf",
"myChartId", "400", "300", "0", "1" );
myChart.setXMLUrl("summary-data.xml");
myChart.render("chartContainer");
FusionCharts("myChartId").configureLink
(
{
width : '100%',
height: '100%',
id: 'linked-chart',
renderAt : "linkedchart-container",
overlayButton: { show : false }
},0
);
FusionCharts("myChartId").addEventListener('BeforeLinkedItemOpen',
function() {
$.prettyPhoto.open("#prettyphoto-container",'LinkedCharts in PrettyPhoto','FusionWidgets XT');
}
);
// --></script>
</body>
</html>
In order to render the link charts in a jQuery PrettyPhoto, you do not have to make any changes to the XML. For the above example we have used the same XML as discussed previously in this page.
Through the above code, we do the following:
- Include the jQuery UI and PrettyPhoto library files
<link href="resources/jquery.ui/jquery-ui.css" rel="stylesheet" type="text/css" /> <script src="resources/jquery.ui/jquery.min.js" type="text/javascript" ></script> <script src="resources/jquery.ui/jquery-ui.min.js" type="text/javascript" ></script> <link rel="stylesheet" href="resources/prettyPhoto/css/prettyPhoto.css" type="text/css" media="screen" charset="utf-8" /> <script src="resources/prettyPhoto/js/jquery.prettyPhoto.js" type="text/javascript" charset="utf-8"></script>
<script type="text/javascript" src="Charts/FusionCharts.js"></script>
<div id="chartContainer">Parent chart will load here</div> <div id="prettyphoto-container"> <div id="linkedchart-container" ></div> </div>
$('#linkedchart-container').prettyPhoto( {
opacity: 0.35,
showTitle: true,
allowresize: true
});
<style type="text/css">
#prettyphoto-container {
display: none;
height: 320px;
width: 550px;
}
</style>
var myChart = new FusionCharts( "../../../../Charts/Pyramid.swf",
  "myChartId", "400", "300", "0", "1" );
myChart.setXMLUrl("summary-data.xml");
myChart.render("chartContainer");

FusionCharts("myChartId").configureLink(
  {
    width : '100%',
    height: '100%',
    id: 'linked-chart',
    renderAt : "linkedchart-container",
    overlayButton: { show : false }
  },0
);
FusionCharts("myChartId").addEventListener('BeforeLinkedItemOpen',
function() {
$.prettyPhoto.open("#prettyphoto-container",'LinkedCharts in PrettyPhoto','FusionWidgets XT');
}
);
Watch it live!
<html>
<head>
<script type="text/javascript" src="../../../../Charts/FusionCharts.js"></script>
<script type="text/javascript" src="resources/highslide-4.1.9/highslide/highslide-full.packed.js"></script>
<link rel="stylesheet" type="text/css" href="resources/highslide-4.1.9/highslide/highslide.css" />
<script src="resources/jquery.ui/jquery.min.js" type="text/javascript"></script>
<script type="text/javascript"><!--
$(document).ready(function() {
hs.graphicsDir = 'resources/highslide-4.1.9/highslide/graphics/';
hs.outlineType = 'rounded-white';
});
// --></script>
</head>
<body>
<div id="chartContainer">Parent chart will load here</div>
<div class="highslide-html-content" id="highslide-html" style="height: 320px; width: 500px" >
<div class="highslide-header" >
<ul >
<li class="highslide-move" >
<a href="#" onclick="return false" >Move</a >
</li >
<li class="highslide-close" >
<a href="#" onclick="return hs.close(this)" >Close</a >
</li >
</ul >
</div >
<div class="highslide-body" style="height: 100%; width: 100%" >
<div id="linkedchart-container" style="height: 100%; width: 100%" >LinkedChart will load here </div >
</div >
<div class="highslide-footer" >
<div >
<span class="highslide-resize" title="Resize" >
<span ></span >
</span >
</div >
</div >
</div >
<script type="text/javascript"><!--
var myChart = new FusionCharts( "../../../../Charts/Pyramid.swf",
"myChartId", "400", "300", "0", "1" );
myChart.setXMLUrl("summary-data.xml");
myChart.render("chartContainer");
FusionCharts("myChartId").configureLink
(
{
width : '100%',
height: '100%',
id: 'linked-chart',
renderAt : "linkedchart-container",
overlayButton: { show : false }
},0
);
FusionCharts("myChartId").addEventListener('BeforeLinkedItemOpen',
function() {
hs.htmlExpand(null, { contentId : 'highslide-html' } );
}
);
hs.Expander.prototype.onAfterClose = function() {
$('#linkedchart-container').remove();
return false;
};
// --></script>
</body>
</html>
In order to render the link charts in a Highslide, you do not have to make any changes to the XML. For the above example we have used the same XML as discussed previously in this page.
Through the above code, we do the following:
- Include the Highslide and jQuery library files
<script type="text/javascript" src="resources/highslide-4.1.9/highslide/highslide-full.packed.js"></script> <link rel="stylesheet" type="text/css" href="resources/highslide-4.1.9/highslide/highslide.css" /> <script src="resources/jquery.ui/jquery.min.js" type="text/javascript"></script>
<script type="text/javascript" src="../../../../Charts/FusionCharts.js"></script>
<div id="chartContainer">Parent chart will load here</div>
<div class="highslide-html-content" id="highslide-html" style="height: 320px; width: 500px" >
<div class="highslide-header" >
<ul>
<li class="highslide-move" >
<a href="#" onclick="return false" >Move</a >
</li >
<li class="highslide-close" >
<a href="#" onclick="return hs.close(this)" >Close</a >
</li >
</ul >
</div >
<div class="highslide-body" style="height: 100%; width: 100%" >
<div id="linkedchart-container" style="height: 100%; width: 100%" >LinkedChart will load here</div >
</div >
<div class="highslide-footer" >
<div>
<span class="highslide-resize" title="Resize" >
<span ></span >
</span >
</div >
</div >
</div > hs.graphicsDir = 'resources/highslide-4.1.9/highslide/graphics/'; hs.outlineType = 'rounded-white';
var myChart = new FusionCharts( "../../../../Charts/Pyramid.swf",
  "myChartId", "400", "300", "0", "1" );
myChart.setXMLUrl("summary-data.xml");
myChart.render("chartContainer");

FusionCharts("myChartId").configureLink(
  {
    width : '100%',
    height: '100%',
    id: 'linked-chart',
    renderAt : "linkedchart-container",
    overlayButton: { show : false }
  },0
);
FusionCharts("myChartId").addEventListener('BeforeLinkedItemOpen',
  function() {
     hs.htmlExpand(null, {  contentId : 'highslide-html' } );
  }
);

hs.Expander.prototype.onAfterClose = function() {
  $('#linkedchart-container').remove();
  return false;
};
Watch it live!
<html>
    <head>
      <script type="text/javascript" src="../../../../Charts/FusionCharts.js"></script>
      <link rel="stylesheet" type="text/css" href="resources/ext-js/resources/css/ext-all.css" />
      <script type="text/javascript" src="resources/ext-js/js/ext-base.js"></script>
      <script type="text/javascript" src="resources/ext-js/js/ext-all.js"></script>
      <script type="text/javascript" src="resources/jquery.ui/jquery.min.js"></script>
      <script type="text/javascript"><!--
        // Global win variable
        var win;
         $(document).ready( function() {

           // create the window on the first click and reuse on subsequent clicks
           if(!win) {
             win = new Ext.Window({
               applyTo:'extjs-container',
               layout:'fit',
               width:520,
               height:352,
               closeAction:'hide',
               plain: true,

               items: new Ext.TabPanel({
                 applyTo: 'linkedchart-container',
                 autoTabs:true,
                 activeTab:0,
                 deferredRender:false,
                 border:false
               }),

               buttons: [{
                 text: 'Close',
                 handler: function(){
                   win.hide();
                 }
               }]
           });
         }
      });

    // --></script>

    </head>

    <body>
      <div id="chartContainer">Parent chart will load here</div>
      <div id="extjs-container" class="x-hidden">
          <div class="x-window-header">LinkedCharts in ExtJS window</div>
          <div id="linkedchart-container" style="height: 100%">LinkedChart will render here</div>
      </div>
    <script type="text/javascript"><!--

        var myChart = new FusionCharts( "../../../../Charts/Pyramid.swf",
          "myChartId", "400", "300", "0", "1" );
        myChart.setXMLUrl("summary-data.xml");
        myChart.render("chartContainer");

       FusionCharts("myChartId").configureLink
       (
         {
           width : '100%',
           height: '100%',
           id: 'linked-chart',
           renderAt : "linkedchart-container",
           overlayButton: { show : false }
          },0
       );

       FusionCharts("myChartId").addEventListener('BeforeLinkedItemOpen',
         function() {
           win.show(this);
          }
        );


    // --></script>

    </body>
</html>
In order to render the link charts in a ExtJS window, you do not have to make any changes to the XML. For the above example we have used the same XML as discussed previously in this page.
Through the above code, we do the following:
- Include the jQueryUI library files
<link href="resources/jquery.ui/jquery-ui.css" rel="stylesheet" type="text/css" />
<script src="resources/jquery.ui/jquery.min.js" type="text/javascript"></script>
<script src="resources/jquery.ui/jquery-ui.min.js" type="text/javascript"></script>
<script type="text/javascript" src="Charts/FusionCharts.js"></script>
<div id="chart-container">Parent chart will load here</div>

<div id="extjs-container" class="x-hidden">
  <div class="x-window-header">LinkedCharts in ExtJS window</div>
  <div id="linkedchart-container" style="height: 100%">LinkedChart will render here</div>
</div>
if(!win) {
  win = new Ext.Window({
    applyTo:'extjs-container',
    layout:'fit',
    width:520,
    height:352,
    closeAction:'hide',
    plain: true,

    items: new Ext.TabPanel({
      applyTo: 'linkedchart-container',
      autoTabs:true,
      activeTab:0,
      deferredRender:false,
      border:false
    }),

    buttons: [{
      text: 'Close',
      handler: function(){
        win.hide();
      }
    }]
  });
} var myChart = new FusionCharts( "../../../../Charts/Pyramid.swf",
"myChartId", "400", "300", "0", "1" );
myChart.setXMLUrl("summary-data.xml");
myChart.render("chartContainer");
FusionCharts("myChartId").configureLink(
{
width : '100%',
height: '100%',
id: 'linked-chart',
renderAt : "linkedchart-container",
overlayButton: { show : false }
},0
);
FusionCharts("myChartId").addEventListener('BeforeLinkedItemOpen',
  function() {
    win.show(this);
  }
);