Starting FusionWidgets XT, FusionWidgets XT also allows you to create JavaScript charts (sometimes also referred to as HTML5 charts). This feature allows you to create charts in web browsers where Flash Player is not supported or is not installed or is disabled, e.g. in iPhone/iPad. FusionWidgets XT internally uses a modified version of Raphaël library to generate JavaScript charts. This feature works seamlessly with the current implementation mode of FusionWidgets XT, which means you do not have to write any additional code to implement this. FusionCharts JavaScript Class automatically detects devices like iPhone/iPad/iPod, where Flash is not supported and renders JavaScript charts instead. Moreover, you can also ignore Flash and only use JavaScript for charting.
Code examples discussed in this section are present in Download Package > Code > MyFirstChart folder.
First, let's look at the default code, which enables rendering of both Flash and JavaScript charts - with JavaScript rendering coming into effect, only when Flash Player is not available.
<html>
<head>
<title>My First chart using FusionWidgets XT</title>
	<script type="text/javascript" src="Charts/FusionCharts.js"></script>
</head>
<body>
	<div id="chartContainer">FusionWidgets XT will load here!</div>
	<script type="text/javascript"><!--
		var myChart = new FusionCharts( "Charts/AngularGauge.swf", "myChartId", "400", "300", "0" );
		myChart.setXMLUrl("Data.xml");
		myChart.render("chartContainer");
	// -->
	</script>
</body>
</html>
See it live in your iPad or iPhone or any browser where Flash Player is not supported.
<html>
  <head>
    <title>My First chart using FusionWidgets XT - Using Data String method</title>
    <script type="text/javascript" src="Charts/FusionCharts.js"></script>
  </head>
  <body>
    <div id="chartContainer">FusionWidgets XT will load here!</div>
    <script type="text/javascript"><!--

      var myChart = new FusionCharts( "Charts/AngularGauge.swf",
		    "myChartId", "400", "300", "0" );

      myChart.setXMLData('<chart lowerLimit="0" upperLimit="100" ' +
		'lowerLimitDisplay="Bad" upperLimitDisplay="Good" numberSuffix="%" showValue="1">' +
			'<colorRange>' +
				'<color minValue="0" maxValue="75" code="FF654F"/>' +
				'<color minValue="75" maxValue="90" code="F6BD0F"/>' +
				'<color minValue="90" maxValue="100" code="8BBA00"/>' +
			'</colorRange>' +
			'<dials>' +
				'<dial value="92"/>' +
			'</dials>' +
		'</chart>");

      myChart.render("chartContainer");
    // -->
    </script>
  </body>
</html>
See it live in your iPad or iPhone or any browser where Flash Player is not supported.
As you can see, the code has not changed a bit from our first sample - customer-satisfaction.html. That's exactly our point! If you open this page in your iPad or iPhone or any browser where Flash Player is not supported, you will see that the charts have been rendered using JavaScript. FusionCharts JavaScript Class automatically does this for you.
Starting FusionWidgets XT - Service Release 1, you can specify the JavaScript chart alias (as listed in the Chart List page) instead of the chart SWF filename to create a pure JavaScript chart. The code snippet below demonstrates how this is achieved:
<html>
  <head>
    <title>Creating Pure JavaScript chart</title>
    <script type="text/javascript" src="FusionCharts/FusionCharts.js"></script>
  </head>
  <body>
    <div id="chartContainer">FusionWidgets XT will load here!</div>
    <script type="text/javascript"><!--

      var myChart = new FusionCharts( "AngularGauge", "myChartId", "400", "300" );
      myChart.setXMLUrl("Data.xml");
      myChart.render("chartContainer");
    // -->
    </script>
  </body>
</html>
See it live!
In the above code, instead of AngularGauge.swf we have specified AngularGauge, the JavaScript chart alias. Based on the JavaScript chart alias provided, FusionCharts JavaScript Class renders the respective JavaScript chart.
You can also specify JavaScript chart alias while using the Object as Constructor parameter through the type property as shown below:
 var myChart = new FusionCharts( {
	type: 'AngularGauge',
	width: '400',
	height: '300',
	debugMode : false
});
You may also opt to render JavaScript charts/gauges using the SWF file name along with its path. For this, you just have to add a line of code as shown below:
FusionCharts.setCurrentRenderer('javascript')
This code will ask FusionWidgets XT renderer to skip Flash rendering and create pure JavaScript charts.
This setting is applied to all the charts rendered after this line. Hence, if you declare this at the beginning, all the charts in the page will render using JavaScript. You will not need to declare the same for each chart in the page.
The modified code will look like the following:
<html>
<head>
<title>My First chart using FusionWidgets XT - Using pure JavaScript</title>
	<script type="text/javascript" src="Charts/FusionCharts.js"></script>
</head>
<body>
	<div id="chartContainer">FusionWidgets XT  will load here!</div>
	<script type="text/javascript"><!--
		FusionCharts.setCurrentRenderer('javascript');
		var myChart = new FusionCharts( "Charts/AngularGauge.swf", "myChartId", "400", "300", "0" );
		myChart.setXMLUrl("Data.xml");
		myChart.render("chartContainer");
	// -->
	</script>
</body>
</html>
See it live!
<html>
<head>
<title>My First chart using FusionWidgets XT - Using JavaScript</title>
	<script type="text/javascript" src="Charts/FusionCharts.js"></script>
</head>
<body>
	<div id="chartContainer">FusionWidgets XT will load here!</div>
	<script type="text/javascript"><!--
		FusionCharts.setCurrentRenderer('javascript');
		var myChart = new FusionCharts( "Charts/AngularGauge.swf", "myChartId", "400", "300", "0" );
		myChart.setXMLData('<chart lowerLimit="0" upperLimit="100" ' +
			'lowerLimitDisplay="Bad" upperLimitDisplay="Good" numberSuffix="%" showValue="1">' +
			'<colorRange>' +
			'<color minValue="0" maxValue="75" code="FF654F"/>' +
			'<color minValue="75" maxValue="90" code="F6BD0F"/>' +
			'<color minValue="90" maxValue="100" code="8BBA00"/>' +
			'</colorRange>' +
			'<dials>' +
			'<dial value="92"/>' +
			'</dials>' +
			'</chart>');
		myChart.render("chartContainer");
	// -->
	</script>
</body>
</html>
See it live!
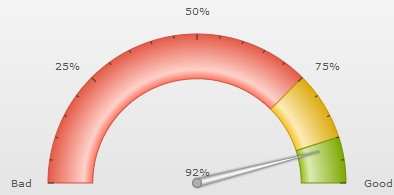
When you open this page, you will see that even in regular browsers, the chart comes in pure JavaScript form as shown below: