FusionWidgets XT (v3.2) introduces macros for annotations. Macros are pre-defined variables which assume values at run-time. These values are generated dynamically based on the positions of various visual elements of a chart or gauge. The macros can be set as the value for the x and y positions of an annotation or annotation group. For example, the macro $chartCenterX always provides the horizontal-center position of a chart or gauge. If you want to place a circle annotation at the center of a chart or gauge, set x="$chartCenterX" and y="$chartCenterY" while defining the circle annotation. The circle will be placed at the center of the chart or gauge.
To enable macros in annotations, set the manageResize attribute to 1 in the <chart> element of the XML or in the chart Object of the JSON.
Let's take an example showing circles around an angular gauge. Suppose we have the following angular gauge that shows a clock:
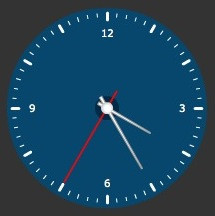
We provide a circular blue background to the clock as well as a dark blue pivotal circle at the center of the clock.
The XML/JSON for the same is:
<chart animation="0" bgColor="333333" baseFontColor="FFFFFF" bgAlpha="100"
   gaugeStartAngle="90" gaugeEndAngle="-270" lowerLimit="0" lowerLimitDisplay=" "
   upperLimit="12" majorTMNumber="12" majorTMThickness="3" majorTMColor="FFFFFF" majorTMHeight="7"
   minorTMNumber="4" minorTMColor="FFFFFF" minorTMHeight="4" placeValuesInside="1" tickValueStep="3" tickValueDistance="20"
   gaugeOuterRadius="95" gaugeInnerRadius="95" showShadow="0" pivotRadius="6" pivotFillColor="FFFFFF" annRenderDelay="0"
   showToolTip="0" manageResize="1" origW="270" origH="270" >
	<dials>
		<dial id="hrs" value="4" color="FFFFFF" baseWidth="3" topWidth="1" radius="50" rearExtension="10"/>
		<dial id="min" value="5" color="FFFFFF" baseWidth="3" topWidth="1" radius="70" rearExtension="13"/>
		<dial id="sec" value="7" color="FF0000" baseWidth="2" topWidth="1.5" alpha="100" radius="86" rearExtension="20" borderAlpha="0"/>
	</dials>
	<annotations>
		<annotationGroup id="Grp1" showBelow="1" x="$chartCenterX" y="$chartCenterY" >
			<annotation type="circle" x="0" y="0" color="07476D" radius="100" />
		</annotationGroup>
		<annotationGroup id="Grp2" showBelow="1" x="0" y="0">
			<annotation type="circle" radius="12" x="$chartCenterX" y="$chartCenterY" color="012A46" />
	</annotationGroup>
</annotations>
</chart>
{
  "chart": {
    "animation": "0",
    "bgcolor": "333333",
    "basefontcolor": "FFFFFF",
    "bgalpha": "100",
    "gaugestartangle": "90",
    "gaugeendangle": "-270",
    "lowerlimit": "0",
    "upperlimit": "12",
    "lowerlimitdisplay": " ",
    "majortmnumber": "12",
    "majortmthickness": "3",
    "majortmcolor": "FFFFFF",
    "majortmheight": "7",
    "minortmnumber": "4",
    "minortmcolor": "FFFFFF",
    "minortmheight": "4",
    "placevaluesinside": "1",
    "tickvaluestep": "3",
    "tickvaluedistance": "20",
    "gaugeouterradius": "95",
    "gaugeinnerradius": "95",
    "showshadow": "0",
    "pivotradius": "6",
    "pivotfillcolor": "FFFFFF",
    "annrenderdelay": "0",
    "showtooltip": "0",
    "manageresize": "1",
    "origw": "270",
    "origh": "270"
  },
  "dials": {
    "dial": [
      {
        "id": "hrs",
        "value": "4",
        "color": "FFFFFF",
        "basewidth": "3",
        "topwidth": "1",
        "radius": "50",
        "rearextension": "10"
      },
      {
        "id": "min",
        "value": "5",
        "color": "FFFFFF",
        "basewidth": "3",
        "topwidth": "1",
        "radius": "70",
        "rearextension": "13"
      },
      {
        "id": "sec",
        "value": "7",
        "color": "FF0000",
        "basewidth": "2",
        "topwidth": "1.5",
        "alpha": "100",
        "radius": "86",
        "rearextension": "20",
        "borderalpha": "0"
      }
    ]
  },
  "annotations": {
    "autoscale": "1",
    "origw": "270",
    "origh": "270",
    "groups": [
      {
        "id": "Grp1",
        "showbelow": "1",
        "x": "$chartCenterX",
        "y": "$chartCenterY",
        "items": [
          {
            "type": "circle",
            "x": "0",
            "y": "0",
            "color": "07476D",
            "radius": "100"
          }
        ]
      },
      {
        "id": "Grp2",
        "showbelow": "1",
        "x": "0",
        "y": "0",
        "items": [
          {
            "type": "circle",
            "radius": "12",
            "x": "$chartCenterX",
            "y": "$chartCenterY",
            "color": "012A46"
          }
        ]
      }
    ]
  }
}
See it live!
In the above data, you have done the following:
- Created two annotation groups
- Set the x position of the first group using the $chartCenterX macro
- Set the y position of the first group using the $chartCenterY macro
- Added a blue circle with x and y positions set to 0
- Set the x and y positions of the second group to 0
- Added a dark blue small circle with the x position set using $chartCenterX macro and the y position set using $chartCenterY macro
In an angular gauge the $chartCenterX macro and the $chartCenterY macro point to the center of the gauge (which is the common center position of the dials). Thus, the first annotation group is positioned at this central point. The center of the blue circle, with x and y set to 0, is also set to this center. The second annotation group is positioned at the top-left corner of the gauge. However, the center of the small circle is fixed to the center of the gauge using the relevant macros.
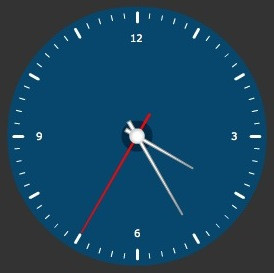
Note: The values provided by the macros change dynamically when a chart or gauge resizes. Thus, irrespective of the size of the above rendered gauge, the annotations are always placed at the center of the gauge. Consider the image shown below:
See it live!
Here, the gauge is rendered using a different size. The XML is not changed. However, the positions of the annotations have changed automatically.
You can set macros in the following attributes of annotation groups and annotations:
- You can set macros to the x attribute of both annotation group and annotation
- You can set macros to the y attribute of both annotation group and annotation
- You can set macros to the toX and toY attributes
You cannot set macros to the xShift, yShift, xScale, yScale, radius, yRadius and innerRadius attributes.
List of macro names
FusionWidgets XT supports the following macros for annotations and annotation groups:
| Macro Name | Description | Support Chart Type |
| $chartStartX | Chart start X position. It's 0 if you're loading the chart in an HTML page. However, if you're loading the chart in another Flash movie, it will take the given X position. | All charts and gauges in FusionWidgets XT |
| $chartStartY | Chart start Y position. It's 0 if you're loading the chart in an HTML page. However, if you're loading the chart in another Flash movie, it will take the given Y position. | All charts and gauges in FusionWidgets XT |
| $chartEndX | End X position of the chart. Same as the width of chart if you're loading the chart in an HTML page. | All charts and gauges in FusionWidgets XT |
| $chartEndY | End Y position of the chart. Same as the height of chart if you're loading the chart in an HTML page. | All charts and gauges in FusionWidgets XT |
| $chartCenterX | Center X position of the chart. | All charts and gauges in FusionWidgets XT |
| $chartCenterY | Center Y position of the chart. | All charts and gauges in FusionWidgets XT |
| $chartWidth | Width of the chart. | All charts and gauges in FusionWidgets XT |
| $chartHeight | Height of the chart. | All charts and gauges in FusionWidgets XT |
| $gaugeStartX | Gauge start X position. | Horizontal linear gauge and LED gauges |
| $gaugeStartY | Gauge start Y position. | Horizontal linear gauge and LED gauges |
| $gaugeEndX | End X position of the gauge. | Horizontal linear gauge and LED gauges |
| $gaugeEndY | End Y position of the gauge. | Horizontal linear gauge and LED gauges |
| $gaugeCenterX | Center X position of the gauge. | Bulb gauge and LED gauges |
| $gaugeCenterY | Center Y position of the gauge. | Bulb gauge and LED gauges |
| $gaugeStartAngle | Start angle of the gauge. | Angular gauge |
| $gaugeEndAngle | End angle of the gauge. | Angular gauge |
| $gaugeRadius | Radius of the gauge. | Bulb gauge |
| $canvasStartX | Canvas start X position (from left) i.e., x co-ordinate of left side of the canvas. | All Real-time data-streaming charts, Spark charts, Bullet graphs, Funnel chart, Pyramid chart and Drawing Pad |
| $canvasStartY | Canvas start Y position (from top) i.e., y co-ordinate of the top of canvas. | All Real-time data streaming charts, Spark charts, Bullet graphs, Funnel chart, Pyramid chart and Drawing Pad |
| $canvasEndX | End X position of canvas i.e., x co-ordinate of right side of canvas. | All Real-time data streaming charts, Spark charts, Bullet graphs, Funnel chart, Pyramid chart and Drawing Pad |
| $canvasEndY | End Y position of canvas i.e., y co-ordinate of bottom of canvas. | All Real-time data-streaming charts, Spark charts, Bullet graphs, Funnel chart, Pyramid chart and Drawing Pad |
| $canvasCenterX | Center X position of canvas. | All Real-time data-streaming charts, Spark charts, Funnel chart, Pyramid chart and Drawing Pad |
| $canvasCenterY | Center Y position of canvas. | All Real-time data streaming charts, Spark charts, Funnel chart, Pyramid chart and Drawing Pad |
| $canvasWidth | Width of canvas. | All Real-time data streaming charts, Funnel chart, Pyramid chart and Drawing Pad |
| $canvasHeight | Height of canvas. | All Real-time data streaming charts, Funnel chart, Pyramid chart and Drawing Pad |
| $plotWidth | Width of the whole Funnel or Pyramid plot | Funnel chart and Pyramid charts |
| $plotSemiWidth | Half-width of the whole Funnel or Pyramid plot | Funnel chart and Pyramid charts |
| Angular gauge |
|
||||||||||||||||||||||||||||||||||||||||||||||||||||||||||||
| Bulb gauge | |||||||||||||||||||||||||||||||||||||||||||||||||||||||||||||
| Cylinder gauge | |||||||||||||||||||||||||||||||||||||||||||||||||||||||||||||
| Horizontal Linear gauge | |||||||||||||||||||||||||||||||||||||||||||||||||||||||||||||
| Thermometer gauge | |||||||||||||||||||||||||||||||||||||||||||||||||||||||||||||
| Horizontal LED gauge | |||||||||||||||||||||||||||||||||||||||||||||||||||||||||||||
| Vertical LED gauge | |||||||||||||||||||||||||||||||||||||||||||||||||||||||||||||
| Real-time Area chart | |||||||||||||||||||||||||||||||||||||||||||||||||||||||||||||
| Real-time Column chart | |||||||||||||||||||||||||||||||||||||||||||||||||||||||||||||
| Real-time Line chart | |||||||||||||||||||||||||||||||||||||||||||||||||||||||||||||
| Real-time Stacked Area chart | |||||||||||||||||||||||||||||||||||||||||||||||||||||||||||||
| Real-time Stacked Column chart | |||||||||||||||||||||||||||||||||||||||||||||||||||||||||||||
| Real-time Line (Dual Y) chart | |||||||||||||||||||||||||||||||||||||||||||||||||||||||||||||
| Spark Line chart | |||||||||||||||||||||||||||||||||||||||||||||||||||||||||||||
| Spark Column chart | |||||||||||||||||||||||||||||||||||||||||||||||||||||||||||||
| Spark Win/Loss chart | |||||||||||||||||||||||||||||||||||||||||||||||||||||||||||||
| Horizontal bullet graph | |||||||||||||||||||||||||||||||||||||||||||||||||||||||||||||
| Vertical bullet graph | |||||||||||||||||||||||||||||||||||||||||||||||||||||||||||||
| Funnel chart | |||||||||||||||||||||||||||||||||||||||||||||||||||||||||||||
| Pyramid chart | |||||||||||||||||||||||||||||||||||||||||||||||||||||||||||||
| Gantt chart | |||||||||||||||||||||||||||||||||||||||||||||||||||||||||||||
| Drawing Pad | |||||||||||||||||||||||||||||||||||||||||||||||||||||||||||||
Macro names are case-sensitive. You need to ensure that the macro names are specified in proper case. For example, $canvasstarty will not work (and will log an error in the Debug window in case of Flash charts), unless it is specified as $canvasStartY.
You can also add numeric (integer) values to the macros or subtract numeric (integer) values from macros to offset the annotations. For example, you may want to draw a rectangle 10 pixels away from the chart borders like the image shown below:
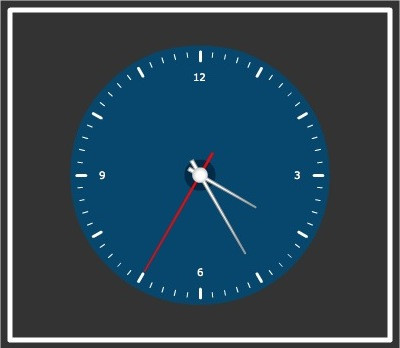
You can define the rectangle as shown in the snippet below:
<annotation type="rectangle"
    x="$chartStartX+10" y="$chartStartY+10"
    toX="$chartEndX-10" toY="$chartEndY-10"
showBorder="1"  borderThickness="5" borderColor="FFFFFF" fillAlpha="0" fillColor="07476D" />
"items": [
          {
            "type": "rectangle",
            "x": "$chartStartX+10",
            "y": "$chartStartY+10",
            "tox": "$chartEndX-10",
            "toy": "$chartEndY-10",
            "showborder": "1",
            "borderthickness": "5",
            "bordercolor": "FFFFFF",
            "fillalpha": "0",
            "fillcolor": "07476D"
          },
...
        ]
See it live!
In the above defined rectangle annotation we have applied macro expressions as described below:
- We have set $chartStartX+10 to the x position. This positions the rectangle 10 pixels away from the left.
- We have set $chartStartY+10 to the y position. This positions the rectangle 10 pixels away from the top.
- We have set $chartEndX-10 to the toX position. This positions the end of the rectangle 10 pixels away from the right.
- We have set $chartEndY-10 to the toY position. This positions the end of the rectangle 10 pixels away from the bottom.
You can only use + or - operators to create a macro expression. You are required to use at least one macro name to create a macro expression. Common mathematical expressions like "30+10-5", which do not contain a macro, are not allowed.
Important Note: While using the dynamic resizing feature, the values provided by macros are not scaled. Rather, these values are re-set with the new values provided by the resized chart. However, the numeric values present in the macro expressions are scaled. For example, the value 10 in the expression $chartStartY+10 is scaled while using dynamic resizing. If do not want this numeric part to be scaled while using the dynamic resizing feature, you need to prefix the number with $. For example, the value 10 in the expression $chartStartY+$10 is NOT scaled while using dynamic resizing.