Each Flash chart is FusionWidgets XT provides a debug mode or debug window. It helps you look into what is happening behind the chart scenes. It also lists out any errors, if present. You can use the debug window to troubleshoot all your charts. The debug window lists errors like:
- Error in loading data - reasons.
- No data to display - possible reasons.
- Invalid XML data - 10 possible reasons.
- If invalid style names are specified for Chart OBJECTS.
- If invalid macros are used for animations using Styles.
- Notifies you when real-time update starts.
- If there's any error retrieving data from the real-time data provider page, it lists the error.
- Notifies you when JavaScript communication takes place.
- and a few more...
Important Note: Debug window is not available in JavaScript charts.
In each chart, you can activate the debug mode by just enabling the debug flag.
A typical debug window for a chart that rendered successfully using Data URL method looks as under:
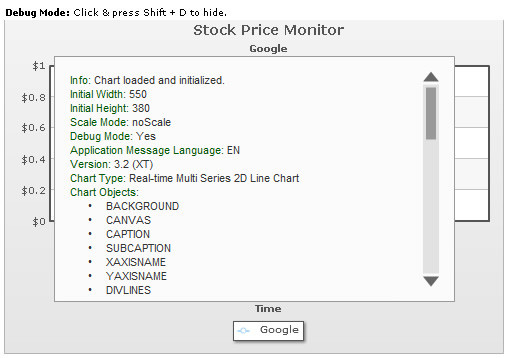
Info: Chart loaded and initialized. Initial Width: 500 Initial Height: 350 Scale Mode: noScale Debug Mode: Yes Application Message Language: EN Version: 3.2 (XT) Chart Type: Real-time Multi Series 2D Line Chart Chart Objects: BACKGROUND CANVAS CAPTION SUBCAPTION XAXISNAME YAXISNAME DIVLINES VDIVLINES YAXISVALUES HGRID VGRID DATALABELS DATAVALUES REALTIMEVALUE TRENDLINES TRENDVALUES DATAPLOT ANCHORS TOOLTIP VLINES VLINELABELS LEGEND
INFO: XML Data provided using Data URL method. Data URL provided: Data.xml Data URL invoked: Data.xml XML Data: <chart caption="Stock Price Monitor" subCaption="Google" dataStreamURL="StockPrice.asp" refreshInterval="60" numberPrefix="$" setAdaptiveYMin="1" xAxisName="Time" showRealTimeValue="1" labelDisplay="Rotate" slantLabels="1"><categories /><dataset seriesName="Google" showValues="0" /><styles><definition><style type="font" name="captionFont" size="14" /></definition><application><apply toObject="Caption" styles="captionFont" /><apply toObject="Realtimevalue" styles="captionFont" /></application></styles></chart> data Stream URL provided: StockPrice.asp INFO: Setting the chart to update its data in 60 seconds. INFO: Setting the chart to re-draw itself in 60 seconds.
From the above Debug Window, you can get the following information:
- A message when chart is loaded and initialized properly.
- Specified width and height.
- Scale Mode, Debug Mode, Application Message Language.
- Chart Version - Which version of chart you're using.
- Chart Type that you're using - Real-time Multi Series 2D Line Chart in this example.
- Objects supported by the chart - This is to help you quickly refer to a chart object without going through individual Chart XML Sheets.
- Method using which XML data has been provided - Can be Data URL or Data String.
- If the Data URL method is used, then link to the original Data URL provided and the invoked. There could be a difference between the two, if your Data URL is URL-Encoded. In that case, FusionWidgets XT converts it into normal form before invoking it. If you get an error in loading data, you can see here if FusionWidgets XT is invoking the right URL. You can also click on the URL to open the page in browser to see any errors thrown by your server-side scripting language.
- The XML data retrieved is also shown for your reference.
- Additionally, if it's a real-time line chart, the debugger also shows the real-time initialization messages.
To hide the debug window and see the chart below, in Debug Mode, you can click inside the respective chart and then press Shift + D. To show it back, again press Shift + D.
To enable the debug mode for any of your charts, you just need to set the debugMode flag to 1.
If you're using FusionCharts JavaScript Class to render a chart, you can set the debugMode flag to 1 as under:
<div id="chartdiv" align="center">The chart will appear within this DIV. This text will be replaced by the chart.</div>
<script type="text/javascript"><!--
   var  myChart = new FusionCharts("RealTimeLine.swf", "myChartId", "600", "300", "1", "0");
   myChart.setXMLUrl("Data.xml");
   myChart.render("chartdiv");
// -->
</script>
See it live!
Use the debug window when building the chart. Once the chart runs fine, set the flag back to 0, so that your end users just see the chart and not the debug window.
Note: Debug Mode error won't help you solve problems relating to path of chart SWF file, as the debug mode is a module inside the chart SWF file. So, unless the SWF file path is correct, you cannot switch debug mode on.
If you're using direct HTML embedding mode, you can provide it as under:
<object classid="clsid:d27cdb6e-ae6d-11cf-96b8-444553540000"
	codebase="http://fpdownload.macromedia.com/pub/shockwave/cabs/flash/swflash.cab#version=8,0,0,0"
	width="500" height="300" id="Line2D">
      <param name="movie" value="RealTimeLine.swf" />
      <param name="FlashVars" value="&dataURL=Data.xml&debugMode=1" />
      <param name="quality" value="high" />

      <embed src="RealTimeLine.swf" flashVars="&dataURL=Data.xml&debugMode=1" quality="high"
			width="500" height="300" name="Line2D"
			type="application/x-shockwave-flash" pluginspage="http://www.macromedia.com/go/getflashplayer" />

</object>
See it live!
In this chart, we've:
- NOT specified either Data URL or Data String. So you can see the Warning above.
- NOT placed a default Data.xml file in the folder. So, FusionWidgets XT tries to look for a Data.xml file, but it cannot find it. So, you get an "Error in Loading Data" message and the debug window lists the possible reasons for it.
You can see the reason for Invalid XML data above. FusionWidgets XT detects it for you and then shows the appropriate message.
To get more information about the error, you can click the Data URL Invoked link and open the XML file in browser.
FusionWidgets XT Debug Window can also capture the following errors in your Style definitions:
- Invalid Style types
- Invalid Macro Names in animation parameter
- Invalid Chart Object Names
- Usage of undefined Style Objects by Chart objects
As you can see, all our errors got caught in the Debug Window and now you can use this effectively to correct your style XML.
There are more errors and messages that the debug window can trap, which we've not shown here. Examples: when you update your chart's data at client using AJAX, all transfer messages are logged so that you easily debug into the application process.
The Debug Window is aimed at making your lives simpler as developers.