Borders and Backgrounds
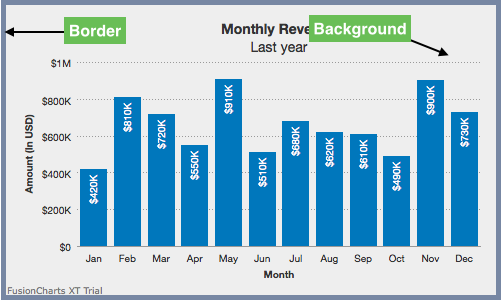
A chart's background refers to the whole area on which it is drawn, and it is enclosed by the chart border, the rectangle around a chart's background.

Show/Hide Chart Borders
By default, the chart borders are visible for 2D charts. To hide the chart border, set the showBorder attribute to 0. Set this attribute to 1 (default) to show the border around the canvas of the chart.
Refer to the code below:
{
"chart": {
"showBorder": "1",
}
}The chart without border will look like as shown below:
Click here to edit the above chart.
Customize Chart Borders
To customize the chart border, the following attributes are used:
Specify the hex code of the border color using the
borderColorattribute.Set the thickness of the border using the
borderThicknessattribute.Set the transparency of the border using the
borderAlphaattribute.
Refer to the code below:
{
"chart": {
"borderColor": "#666666",
"borderThickness": "4",
"borderAlpha": "80"
}
}The chart will look like as shown below:
Click here to edit the above chart.
Customize Chart Background
To customize the chart background, the following attributes are used:
Set the hex code of the color of the background using the
bgColorattribute.Set the transparency of the background using the
bgAlphaattribute.
Refer to the code below:
{
"chart": {
"bgColor": "#DDDDDD",
"bgAlpha": "50"
}
}The chart will look like as shown below:
Click here to edit the above chart.
Use Gradient Background
When using a gradient fill for the background, you can configure three aspects:
Set gradient transparency
Set ratio of color distribution
Set the gradient angle
To do so, the following attributes are used:
Set the hex codes of the gradient colors separated by a comma using the
bgColorattribute.Set the transparency of the background using the
bgAlphaattribute.Set the radius of each color in the gradient using the
bgRatioattribute.Set the angle in degrees of each color using the
bgAngleattribute.
Refer to the code below:
{
"chart": {
"bgColor": "EEEEEE,CCCCCC",
"bgratio": "60,40",
"bgAlpha": "70,80",
"bgAngle": "180"
}
}The chart will look like as shown in the image below:
Click here to edit the above chart.
Use External Image
You can specify an external image (GIF, JPEG or PNG only) as the background of the chart. Use the bgImage attribute to specify the URL of the external image as shown in the code below:
{
"chart":{
"bgImage":"http://upload.wikimedia.org/wikipedia/commons/7/79/Misc_fruit.jpg"
}
} The chart will look like as shown below:
Click here to edit the above chart.
Customize Background Image
You can even customize the external image rendered as the chart background. To do so, the following attributes are used:
Set the transparency level of the background image using the
bgImageAphaattribute.Specify a display mode using the
bgImageDisplayModeattribute. Possible values arestretch,tile,fit,fill,centerandnone.Set the alignment of the image using the
bgImageHAlignand thebgImageVAlignattributes. Possible values for these attributes aretop,middleandbottom.Increase or decrease the scale of the image using the
bgImageScaleattribute.
Refer to the code below:
{
"chart":{
"bgImage":"pizza.jpg",
"bgImageAlpha":"30",
"bgImageScale":"50",
"bgImageVAlign":"bottom",
"bgImageHAlign":"middle",
"bgImageDisplayMode":"center",
}
} The chart will look like as shown in the image below:
Click here to edit the above chart.
Note that alignment attributes are ignored for
centerandstretchdisplay modes andbgImageScaleattribute works only fornone,centerandtiledisplay modes.