Overview
FusionCharts.NET is a charting library for ASP.NET MVC and ASP.NET WebForms, which uses FusionCharts JavaScript (HTML5) library to render interactive charts.
FusionCharts.NET helps you avoid writing messy JavaScript and JSON code within your ASP.NET code, by providing an object-oriented paradigm in which you can render charts using C# or VB. It comes with two modules:
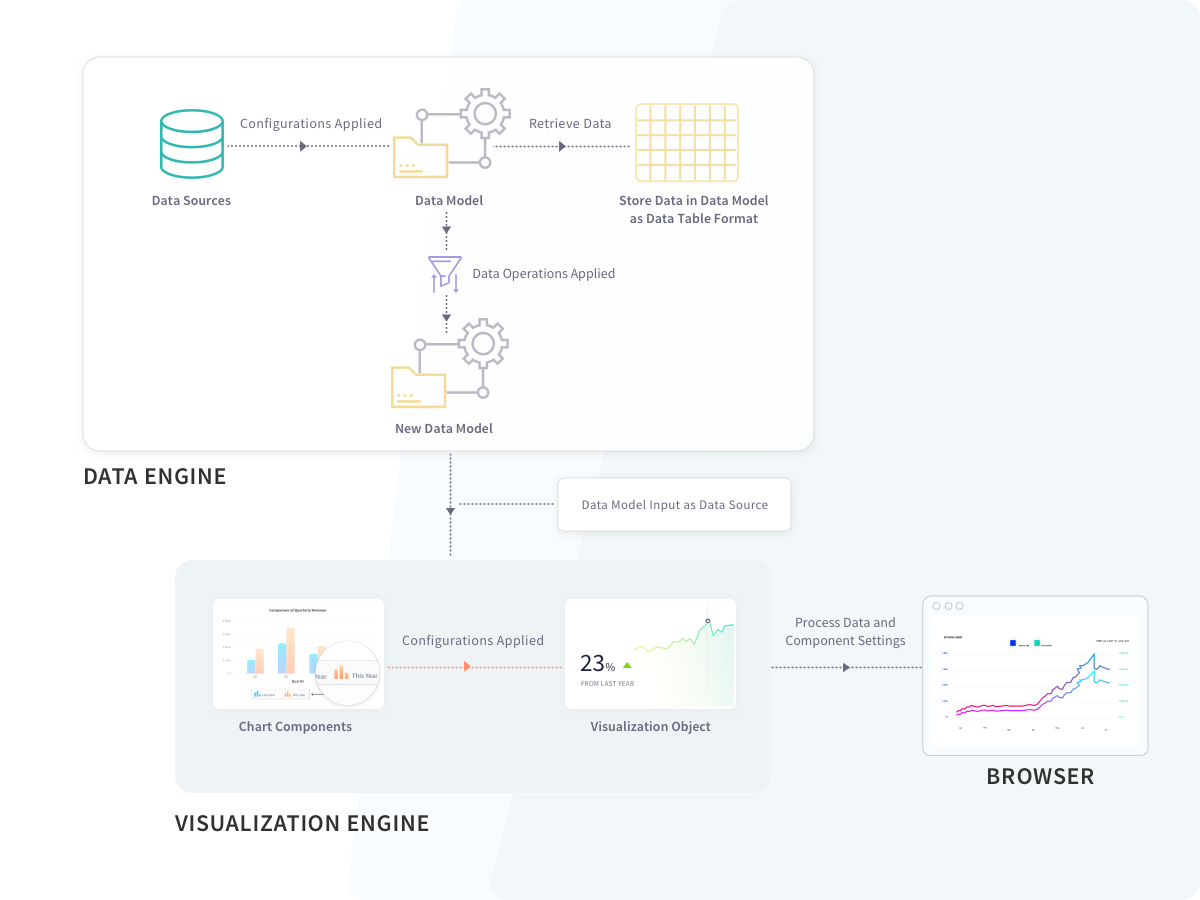
Data Engine - The data engine of FusionCharts.NET allows you to store data and perform operations on it. As such, you can transform and optimize the data, before sending it to the chart renderer. In FusionCharts.NET, the chart renderer accepts data only in the form of
DataModel. The data engine consists of the following:- The data source class, which receives the raw data and creates an object to provide the data to the
DataModel. - The
DataModelreceives and stores the converted data. This is the parentDataModel, which you can provide to the chart renderer to visualize the data. - A
DataModelalso contains data operations, which can be applied to create multiple optimizedDataModels. You can provide any of theseDataModelsto the chart renderer.
- The data source class, which receives the raw data and creates an object to provide the data to the
Visualization - The visualization module of FusionCharts.NET allows you to render the chart with functional and cosmetic configurations, after receiving the data from the data engine.
To help understand better refer to the illustration below:
FusionCharts ASP.NET wrapper vs FusionCharts.NET
| Asp.Net wrapper | FusionCharts.NET | |
|---|---|---|
| Data from different sources | ||
| Static data | ||
| Remote data | ||
| Operations on data | ||
| Handle chart structure specific json | ||
| Conditional data plot formatting | ||
| Page Level theme | ||
| Fully object oriented c#/vb code |