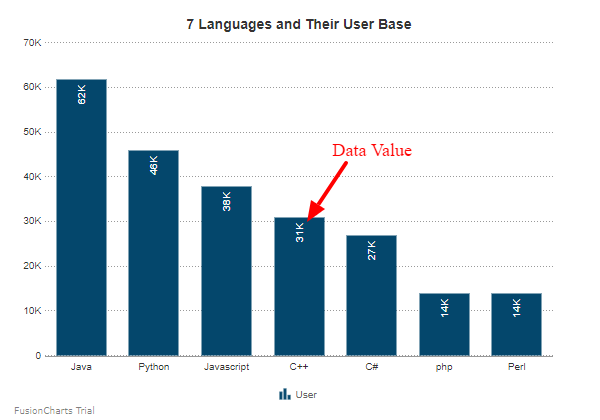
Data Value
Data values are plot values, i.e. values of each data plot (line, column, bar, pie) displayed on the chart.

Customize Data Value
In FusionCharts.NET, you can customize data values in the following ways with the help of different instance methods of the Values object (which accepts a string argument) under the visualizationObj object:
Show/Hide Data Value
To display the data labels, set the value of the Show property to true. Refer to the code given below:
visualizationObj.Values.Show = true;The chart will look as shown below:
Set the Limits
To hide the limit of the chart, set the value of ShowLimits property to false. Refer to the code given below:
visualizationObj.Values.ShowLimits = false;The chart will look as shown below:
Rotate Values
To rotate the data values of the chart, set the value of Rotate property to true. Refer to the code given below:
visualizationObj.Values.Rotate = true;The chart will look as shown below:
Data Value Position
If you've opted to show data values on the chart, ValuePosition property lets you adjust the vertical alignment of data values with respect to dataplots. By default, this attribute is set to AUTO mode in which the alignment of each data value is determined automatically based on the position of each plot point. In ABOVE mode, data values are displayed above the plot points unless a plot point is too close to the upper edge of the canvas while in BELOW mode, data values are displayed below the plot points unless a plot point is too close to the lower edge of the canvas.
Refer to the code given below:
visualizationObj.Values.Position = ValueFormat.ValuePosition.AUTO;Highlight Effect
PlotHighlightEffect property lets you enable/disable the highlight effect, in the form of a fadeout, for the data plots corresponding to a legend item. When this attribute is enabled and the mouse pointer is hovered over a legend item label, plots belonging to the other data series fadeout, by reducing their opacity.
The fadeout effect can be customized by specifying the fadeout color and opacity using the color and alpha attributes. Eg. fadeout|color=#ff0000, alpha=60
Refer to the code below:
visualizationObj.Values.PlotHighlightEffect = "fadeout|color=#ff0000, alpha=60";Place Value
To show the data values inside the column, set the PlaceValueInside property to true. Refer to the code given below:
visualizationObj.Values.PlaceValueInside =true;The chart looks like as shown below: