Y-Axis
In FusionTime, the yAxis object can be specified within the dataSource object of the FusionCharts constructor.
It will accept inputs in two forms - an array of yAxis objects or an array of Strings.
An example of array of yAxis objects is shown in the code below:
yAxis: [{
plot: {
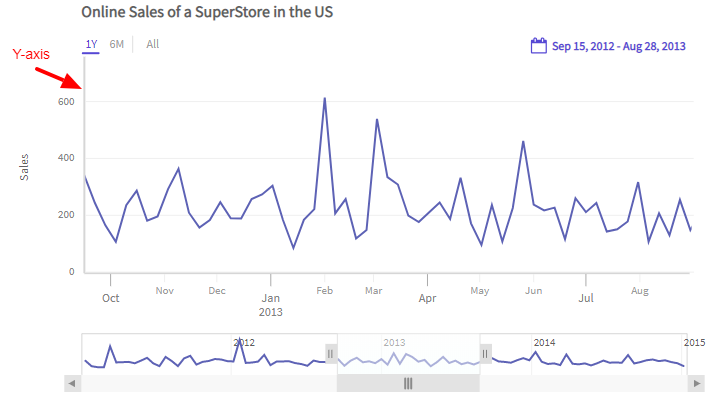
value: 'Sales',
},
}, {
plot: {
value: 'Shipping Cost',
}
}],Refer to the image below:
An array of strings is applicable when you want to provide different configurations for multiple canvases. Refer to the code below:
"yAxis": [{
"plot": ["Sales", "Shipping Cost"]
}]Refer to the chart below:
To configure the y-axis you can:
- Set the column name using the
valueattribute under theplotobject to specify the column which is mapped to the y-axis. - Set the y-axis title using the
titleattribute under theyAxisobject. - Set the suffix and prefix of the y-axis values using the
suffixandprefixattributes under theformatobject within theyAxisobject.
Refer to the code below:
yAxis: [{
plot: {
"value": "Sales",
},
"title": "Total Sales",
}, {
format: {
"prefix": "$",
}
}],Style Definition
You can add CSS styling to set the cosmetic properties of y-axis. To set the styling, instead of creating a separate CSS file, you can define the styling using StyleDefinition object.
Now, let's define the styleDefinition object and set the font color in an object. The code is given below:
styleDefinition: {
"colorstyle": {
"fill": "#ff0000"
}
}Once the StyleDefinition is defined, you can refer it for the various components using colorstyle attribute.
The syntax to set the StyleDefintion to the y-axis label is given below:
{
"yAxis": [
{
"plot": "Sales",
"title": "Sales",
"style": {
"title": "colorstyle"
}
}
]
}In the above code, colorStyle object is called to set the color of the caption.
The chart after applying the above attributes will look like as shown below:
In the above sample, font color of the y-axis label has been changed.
The code to update the cosmetic properties of other elements in y-axis is given below:
{
"yAxis": [
{
"title": "Sales",
"style": {
"ticks": {
"major": Style,
"minor": Style,
"context": Style
},
"text": {
"major": Style,
"minor": Style,
"context": Style
},
"line": Style,
"gridLine": Style,
"gridBand": Style
}
}
]
}