FusionWidgets XT comes with a jQuery plugin that lets you use the jQuery framework and format to render FusionWidgets XT anywhere within a web page.
FusionWidgets XT uses FusionCharts jQuery plugin that takes care of all the products of FusionCharts XT Suite including FusionWidgets XT.
Using FusionCharts jQuery plugin, you can render FusionWidgets XT anywhere within a web page, change chart type, update and retrieve chart data, update functional and cosmetic settings and use all existing features of FusionWidgets XT.
In this page, we will see how to use the FusionCharts jQuery plugin to render charts and gauges from FusionWidgets XT pack.
Code examples and data files discussed in this section are present in Download Package > Code > jQuery folder.
Setting up of FusionCharts jQuery plugin is as simple as putting an additional reference to the plugin file (FusionCharts.jqueryplugin.js) as shown below:
<script type="text/javascript" src="Charts/jquery.min.js"></script>
<script type="text/javascript" src="Charts/FusionCharts.js"></script>
<script type="text/javascript" src="Charts/FusionCharts.jqueryplugin.js"></script>
Note: The required JavaScript files are available in Download Package > Charts folder.
This completes the setup.
- Copy all the required chart SWF files (from the Download Pack > Charts folder) to your preferred folder
- Copy FusionCharts.js and jquery.min.js from the Download Pack > Charts folder to the preferred folder
- Copy FusionCharts.HC.js and FusionCharts.HC.Widgets.js from the Download Pack > Charts folder to the preferred folder
You do not need to include FusionCharts.HC.js and FusionCharts.HC.Widgets.js in your code. FusionCharts.js will automatically load these files based on requirement.
Now, let's create our first chart using FusionCharts jQuery plugin.
We will start with the same Customer satisfaction data which we have created in Creating your first chart page as shown below:
<chart lowerLimit="0" upperLimit="100" lowerLimitDisplay="Bad" upperLimitDisplay="Good" gaugeStartAngle="180" gaugeEndAngle="0" palette="1" numberSuffix="%" tickValueDistance="20" showValue="1"> |
The code to use this data and generate an Angular gauge using FusionCharts jQuery plugin is as follows:
<html>
  <head>
    <title>My First chart using FusionWidgets XT</title>
    <script type="text/javascript" src="Charts/FusionCharts.js"></script>
    <script type="text/javascript" src="Charts/jquery.min.js"></script>
    <script type="text/javascript" src="Charts/FusionCharts.jqueryplugin.js"></script>
  </head>
  <body>
    <div id="chartContainer">FusionWidgets XT will load here!</div>
    <script type="text/javascript"><!--
      $(document).ready(function(){
          $("#chartContainer").insertFusionCharts({
               swfUrl: "Charts/AngularGauge.swf",
               dataSource: "Data.xml",
               dataFormat: "xmlurl",
               width: "400",
               height: "200",
               id: "myChartId"
         });
       });
      // -->
    </script>
  </body>
</html> |
The resultant chart will be rendered as shown in the image below:
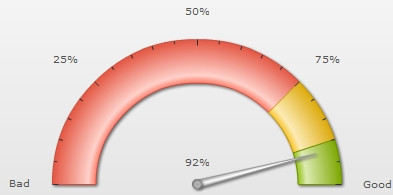
See it live!
How it works?
We save the above code as FirstChart.html. In the above code we have:
- Selected the element (DIV) with id chartContainer
- Called insertFusionCharts method (available from the plugin)
- Passed all required chart configurations like swfUrl, width, height, dataSource, dataFormat, id etc. to the method as JavaScript object
The insertFusionCharts method renders a chart in the selected element. It takes a set of key/value pairs representing chart configurations as parameter. The set is passed as an Object. The properties of the parameter-object are as follows:
| Chart configuration or properties | Description and acceptable value |
| swfUrl | Path (as string) to the chart SWF file. You can get the list of chart SWF file names from Chart List page. |
| id | Sets the DOM id of the chart. The value is provided as string. (optional) |
| width | Width of the chart (optional - default is 400). The value is provided as number if the width is in pixels or as string and if width is to be set in percentage (e.g., "50%") |
| height | Height of the chart (optional - default is 300). The value is provided as number if the height is in pixels or as string and if height is to be set in percentage (e.g., "50%") |
| dataSource | XML or JSON chart data. It can be a URL for XML or JSON. It can also be a string containing XML or JSON object |
| dataFormat | Defines the format of the dataSource.
|
| renderer | Sets the chart renderer engine. Acceptable values are 'flash' and 'javascript'. The default value is flash which generates Flash charts. When set to javascript FusionCharts JavaScript Class renders pure JavaScript charts. (optional) |
| bgColor | This sets the color of the flash player's background on which a chart gets drawn. It is passed as a string containing hex coded color value. This background color is not same as the background color of a chart. This background is visible while showing chart messages or when chart's bgAlpha is set to less than 100. (optional - default value is "#FFFFFF" i.e., white) |
| scaleMode | Flash player's mode of scaling a chart. NoScale is the default value. There are other settings namely, showAll, ExactFit, noBorder. But these are not supported and might result into distorted charts. (optional) |
| lang | Sets the language for chart messages. It presently supports only English. The value is "EN". (optional) |
| detectFlashVersion | Set to "1" to make FusionCharts JavaScript Class check whether Flash Player 8 is present in the Browser. (optional - Default value is "0' ) |
| autoInstallRedirect | Set to "1" with detectFlashVersion set to "1" and FusionCharts redirects to Flash Player installation page of Adobe's Web site. (optional - default is "0') |
| debugMode | Sets the chart debug window on. Can take "0" or "1". When set to "1", the chart shows a debug window over itself. (optional - default value is "0") |
What happens if Flash player is not available?
In case Flash Player is not available on certain devices (like iPad/iPhone), FusionCharts JavaScript Class automatically renders the same chart using JavaScript. If you are running the sample from local file system, please note that you need to provide the data using Data String method, i.e., passing the data (XML/JSON) to the chart as String or JSON Object. Due to security implementation of many browsers which blocks AJAX in local file systems, and since the JavaScript charts use AJAX, the Data URL method (loading data from external XML/JSON file) will not work.
You can also render JavaScript chart using the same method. All you need to do is to explicitly set the renderer property to javascript. In case you are running the sample from local file system, you will also need to set the chart data as string. The code snippet below contains the modified sample:
$("#chartContainer").insertFusionCharts({
               swfUrl: "Charts/AngularGauge.swf",
               renderer : 'JavaScript',
               width: "400",
               height: "200",
               id: "myChartId",

               dataFormat: "xml",
               dataSource: "<chart lowerLimit='0' upperLimit='100' lowerLimitDisplay='Bad' upperLimitDisplay='Good' numberSuffix='%' showValue='1'> "+
               "<colorRange> "+
                  "<color minValue='0' maxValue='75' code='FF654F'/> "+
                  "<color minValue='75' maxValue='90' code='F6BD0F'/> "+
                  "<color minValue='90' maxValue='100' code='8BBA00'/> "+
               "</colorRange> "+
               "<dials> "+
                  "<dial value='92' /> "+
               "</dials> "+
            "</chart>"
});
The resultant chart will look like the image shown below:
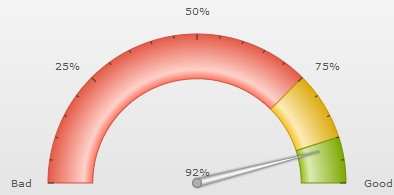
See it live!
Apart from XML you can also provide data in JSON format. You can provide JSON as JavaScript Object, as JSON string or as a URL. To provide data as JSON you need to pass the JSON data source to dataSource property and set json or jsonurl to dataFormat property.
The code snippet below shows how you can pass JSON Object as data source:
$("#chartContainer").insertFusionCharts({
	swfUrl: "Charts/AngularGauge.swf",
	width: "400",
	height: "200",
	id: "myChartId",

	dataFormat: "json",
	dataSource: {
          "chart": {
            "lowerlimit": "0",
            "upperlimit": "100",
            "lowerlimitdisplay": "Bad",
            "upperlimitdisplay": "Good",
            "numbersuffix": "%",
            "showvalue": "1"
          },
          "colorrange": {
            "color": [
              {
                "minvalue": "0",
                "maxvalue": "75",
                "code": "FF654F"
              },
              {
                "minvalue": "75",
                "maxvalue": "90",
                "code": "F6BD0F"
              },
              {
                "minvalue": "90",
                "maxvalue": "100",
                "code": "8BBA00"
              }
            ]
          },
          "dials": {
            "dial": [
              {
                "value": "92"
              }
            ]
          }
        }
});
See it live!
The code snippet below shows how you can pass JSON string as data source:
$("#chartContainer").insertFusionCharts({
	swfUrl: "Charts/AngularGauge.swf",
	width: "400",
	height: "200",
	id: "myChartId",

	dataFormat: "json",
	dataSource: '{	\
          "chart": {	 \
            "lowerlimit": "0",  \
            "upperlimit": "100", \
            "lowerlimitdisplay": "Bad", \
            "upperlimitdisplay": "Good", \
            "numbersuffix": "%", \
            "showvalue": "1" \
          }, \
          "colorrange": { \
            "color": [ \
              { \
                "minvalue": "0", \
                "maxvalue": "75", \
                "code": "FF654F" \
              }, \
              { \
                "minvalue": "75", \
                "maxvalue": "90", \
                "code": "F6BD0F" \
              }, \
              { \
                "minvalue": "90", \
                "maxvalue": "100", \
                "code": "8BBA00" \
              } \
            ] \
          }, \
          "dials": { \
            "dial": [ \
              { \
                "value": "92" \
              } \
            ] \
          } \
        }'
});
See it live!
The code snippet below shows how you can pass a JSON URL as data source:
$("#chartContainer").insertFusionCharts({
	swfUrl: "Charts/AngularGauge.swf",
	width: "400",
	height: "200",
	id: "myChartId",

	dataFormat: "jsonurl",
	dataSource: "Data.json"
});
See it live!
The insertFusionCharts method renders a chart inside a container element after removing any existing element present inside the container element. Using the appendFusionCharts method, you can also insert charts to the end of the container element, thus preserving all existing element. An example is shown below:
$("#chartContainer").appendFusionCharts({
   swfUrl: "Charts/AngularGauge.swf",
   dataSource: "NextQuarter.xml",
   dataFormat: "xmlurl",
   width: "200",
   height: "100",
   id: "myChartNextID"
});
See it live!
You can also insert charts to the beginning of the container element using prependFusionCharts method as shown below:
$("#chartContainer").prependFusionCharts({
   swfUrl: "Charts/AngularGauge.swf",
   dataSource: "PreviousQuarter.xml",
   dataFormat: "xmlurl",
   width: "200",
   height: "100",
   id: "myChartPrevID"
});
See it live!
The parameters of the appendFusionCharts and the prependFusionCharts methods are same as the parameters of the insertFusionCharts method.
You can also change chart type of an existing chart. The updateFusionCharts methods helps you to achieve this by modifying the swfUrl property as shown below:
$("#chartContainer").updateFusionCharts({"swfUrl": "Charts/Thermometer.swf"});
See it live!
The updateFusionCharts methods helps you to change data of an existing chart as shown in the code below:
$("#chartContainer").updateFusionCharts({"dataSource": XMLAsString, "dataFormat": "xml"});
See it live!
The updateFusionCharts method also helps in changing the dimensions of an existing chart. The code snippet below shows how this can be achieved:
$("#chartContainer").updateFusionCharts({ width : 280, height : 200 });See it live!
In this section we have showcased some of the basic methods of FusionCharts jQuery plugin and their uses. FusionCharts jQuery plugin additionally provides methods to:
- Retrieve and update chart configurations, chart attributes and chart data
- Clone charts
- Select charts using :FusionCharts selector
- Bind FusionCharts events
We will discuss the complete API and the features of FusionCharts jQuery plugin in FusionWidgets XT and jQuery section.
Listed below are some of the examples using various methods of FusionCharts jQuery samples: