Using this method, you need to provide the URL of chart's data-source (XML/JSON). The chart sends a request for data to the specified URL, reads it, parses it and then renders the charts accordingly. This method can be used to render a new chart or update an existing chart. The image below (followed by the listed steps) illustrate the process involved in a generic Data URL Method:
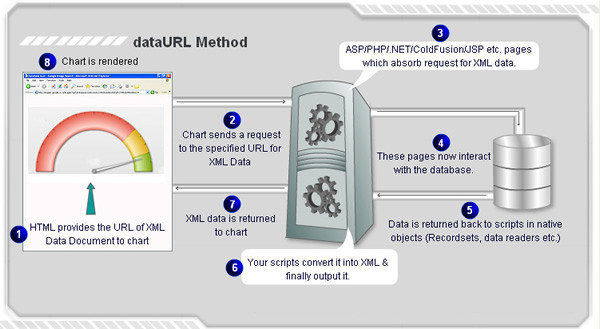
- First, you set the URL of the XML or JSON data as the chart's data-source. This URL points to a static XML/JSON file or to a server-side script that outputs dynamic XML/JSON data
- FusionCharts JavaScript Class or the chart sends a request for XML or JSON data document to the specified URL
- At this URL, your server-side script » like ASP, ASP.NET C#, ASP.NET VB.NET, PHP, J2EE, Ruby on Rails, ColdFusion etc. absorbs the request for XML data
- The server-side script then interacts with database
- The server-side script retrieves data from database in native objects like Recordsets, Data Readers etc.
- The server-side script then generates chart data (XML or JSON) using simple string concatenation or using XML/JSON objects
- The XML/JSON data is relayed to the output stream
- FusionCharts JavaScript Class or the chart now accepts this data, parses it and finally renders the chart
Effectively, in this process you need the following to build a chart:
- Chart Container page - The page that contains the code required to embed the chart. The chart code contains the URL to the XML/JSON Data.
- Chart SWF file - SWF file for the chart that you wish to render. Each chart in FusionWidgets XT is a separate SWF file. For example, if you want to create a real-time angular gauge, you'll need the AngularGauge.swf file.
- FusionCharts Javascript Class files - These files help in embedding the chart SWF file in your HTML page and also rendering JavaScript (HTML5) charts. The required files are - FusionCharts.js, FusionCharts.HC.js, FusionCharts.HC.Widgets.js and jquery.min.js.
- Data Provider page - The server-side page that will provide XML/JSON data to charts. This page outputs ONLY in XML or JSON format with no HTML tags.
<div id="chart1div">
   This text is replaced by the chart.
</div>
<script type="text/javascript">
   var chart1 = new FusionCharts("AngularGauge.swf", "ChId1", "600", "400", "0", "1");
   chart1.setXMLUrl("Data.aspx");
   chart1.render("chart1div");
</script>
FusionCharts JavaScript Class provides other functions to achieve the same : setJSONUrl, setChartDataUrl, setChartData, setDataURL (deprecated)
To ease embedding of charts in your web pages, FusionWidgets XT provides wrapper classes (FusionCharts wrapper classes) ready for various server-side scripts like Classic ASP, ASP.NET C#, ASP.NET VB.NET, PHP, J2EE, Ruby on Rails and ColdFusion.
FusionCharts wrapper classes are present in the FusionCharts XT pack. If you do not have the licensed pack of FusionCharts XT, you can directly download the trial version of FusionCharts XT and get the fully functional wrapper classes from the pack. The wrapper classes are present in the Code folder of FusionCharts XT Download Pack.
Here, we provide highlights of code snippets that are used in each technology to embed FusionWidgets XT using Data URL method.
Using Classic ASP
Call renderChart("../../Charts/AngularGauge.swf", "Data/Data.asp", "", "myFirst", 600, 300, false, false)
Read more.
Using ASP.NET C#
FusionCharts.RenderChart("../Charts/AngularGauge.swf", "Data/Data.aspx", "", "myFirst", "600", "300", false, false);
Read more.
Using ASP.NET VB
FusionCharts.RenderChart("../Charts/AngularGauge.swf", "Data/Data.aspx", "", "myFirst", "600", "300", False, False)
Read more.
Using PHP
renderChart("../../Charts/AngularGauge.swf", "Data/Data.php", "", "myFirst", 600, 300, false, false);
Read more.
Using J2EE
<jsp:include page="../Includes/FusionChartsRenderer.jsp" flush="true">
	<jsp:param name="chartSWF" value="../../Charts/AngularGauge.swf" />
	<jsp:param name="strURL" value="Data/Data.jsp" />
	<jsp:param name="strXML" value="" />
	<jsp:param name="chartId" value="myFirst" />
	<jsp:param name="chartWidth" value="600" />
	<jsp:param name="chartHeight" value="300" />
	<jsp:param name="debugMode" value="false" />
	<jsp:param name="registerWithJS" value="false" />
</jsp:include>
Read more.
Using ColdFusion
<cfoutput>#renderChart("../../Charts/AngularGauge.swf", "Data/Data.cfm", "", "myFirst", 600, 300, false, false)#</cfoutput>
Read more.
Using Ruby on Rails
render_chart '/Charts/AngularGauge.swf', 'Data.builder', '', 'configuredChart', 600, 300, false, false
Read more.