Changed Behavior
This section is for users who are using previous version of FusionCharts in their application. Here we'll talk about the change in behavior of the charts after v3.17.x.
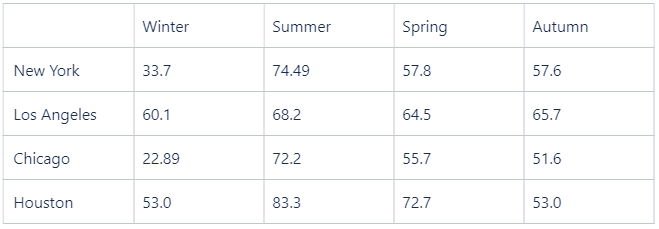
Heat Map charts exports CSV and Excel files correctly
Exporting the Heat Map charts as a CSV or Excel file now displays correct and complete data, previously the exported files had incomplete data.
Before the fix Earlier, the files were exported with missing data.

After the fix Heat Map charts now export CSV and XLS files with complete data.
Chord Diagram exports to SVG format properly
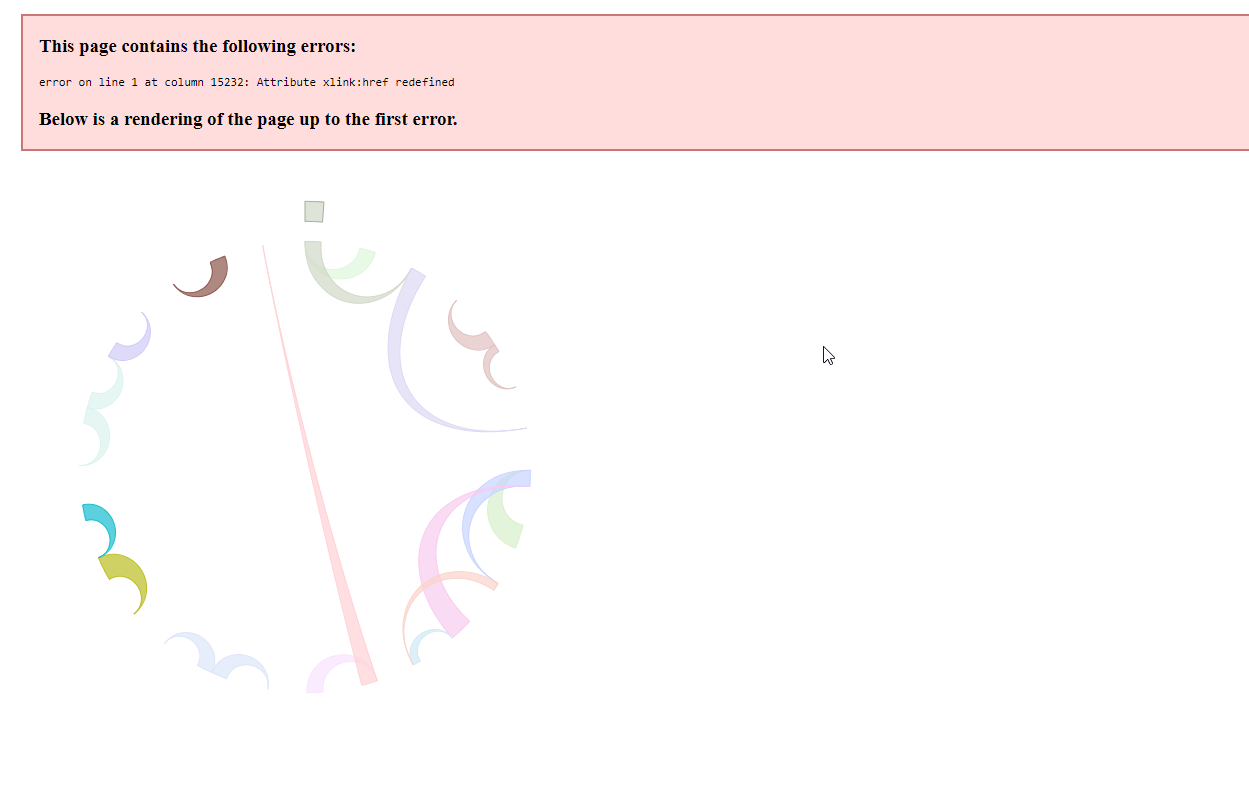
Export a Chord Diagram to an SVG using the getSVGString method or via the Export Menu and see the rendered result in an SVG viewer as expected. Previously using the getSVGString method did not get the proper SVG strings and resulted in an error message.
Before the fix Unable to get the proper SVG strings which resulted in an error message when exporting with the getSVGString method or via the Export Menu.
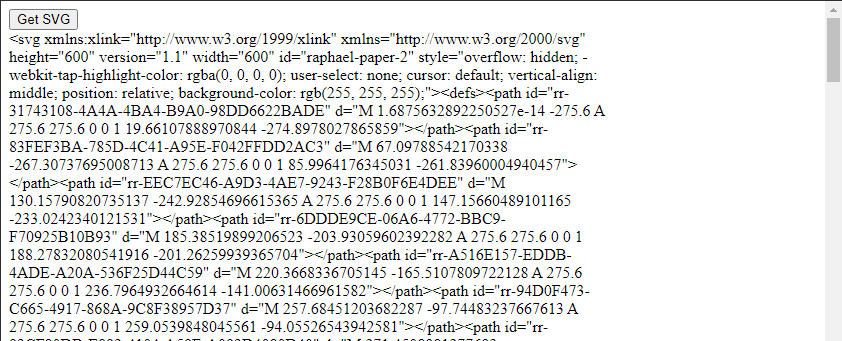
After the fix SVG string is properly generated using both the getSVGString method and via the Export Menu.
Box and Whisker chart exports CSV and XLSX files properly
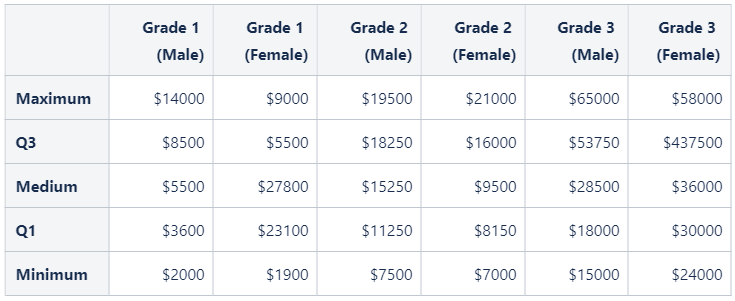
Exporting the Box and Whisker charts as a CSV or Excel file now displays correct and complete data, previously the exported files had incomplete data.
Before the fix When exporting the Box and Whisker charts to CSV or XLSX files, the export API was broken and exported incomplete data, only capturing the first values provided for the individual categories.
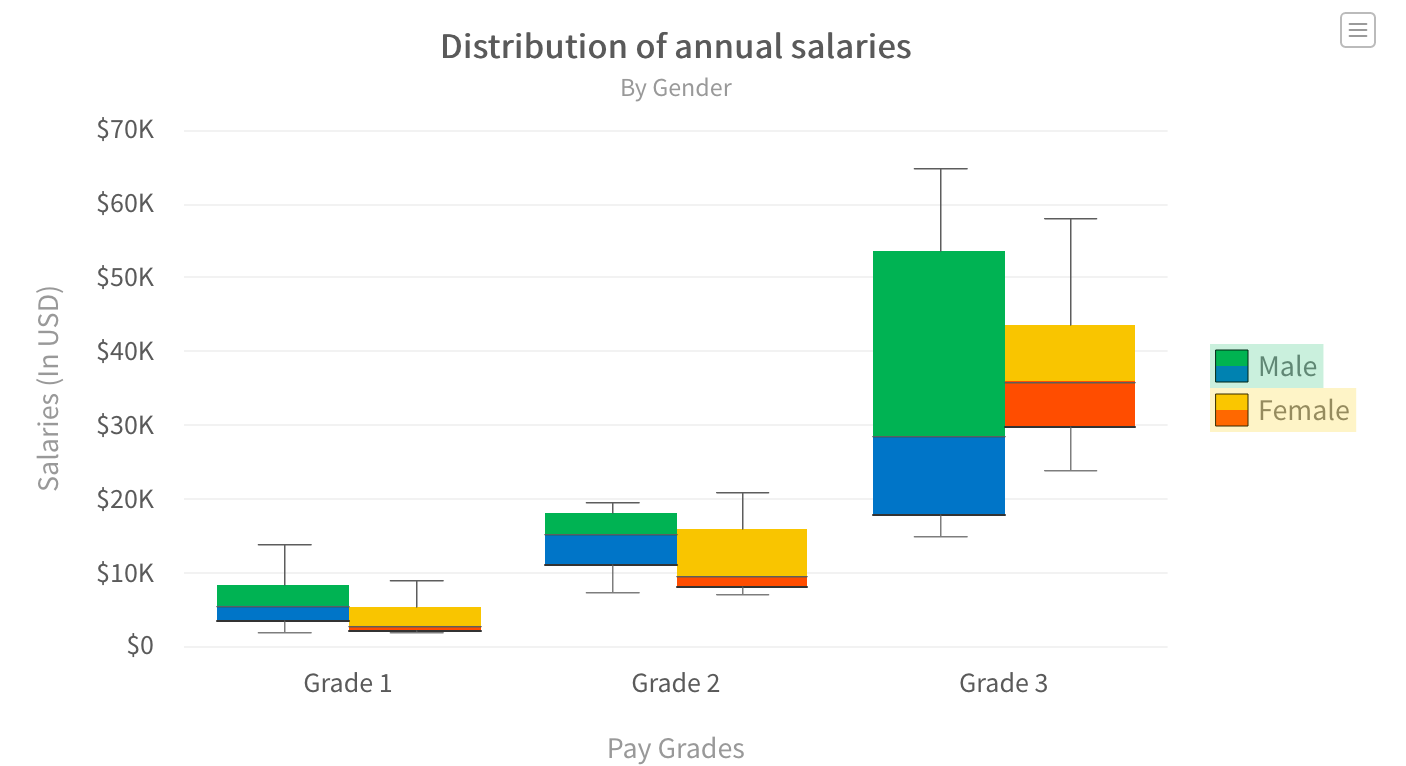
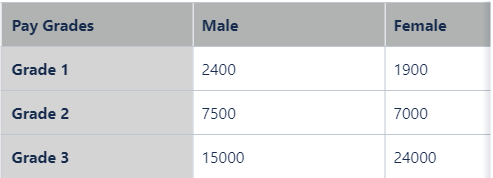
After the fix The Box and Whiskers chart exports properly, displaying all properties as expected.
Bullet graphs display tooltips properly
Bullet graphs are now improved to display tooltips for the target component even if the value property is not configured.
Before the fix Earlier, while plotting Bullet graphs, if the value property was not set, then the tooltip is not shown for the target component.

After the fix The Bullet graph always displays the tooltip for the target components, even if the property value is not previously defined.
