Changed Behavior
This section is for users who are using previous version of FusionCharts in their application. Here we'll talk about the change in behavior of the charts after v3.15.0.
Height of Navigation Bar in Treemap After Drill Down
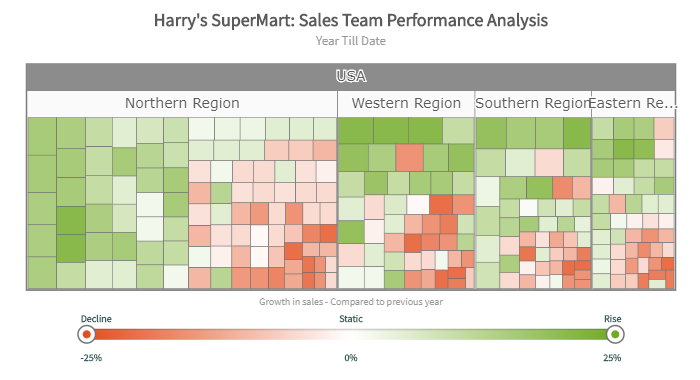
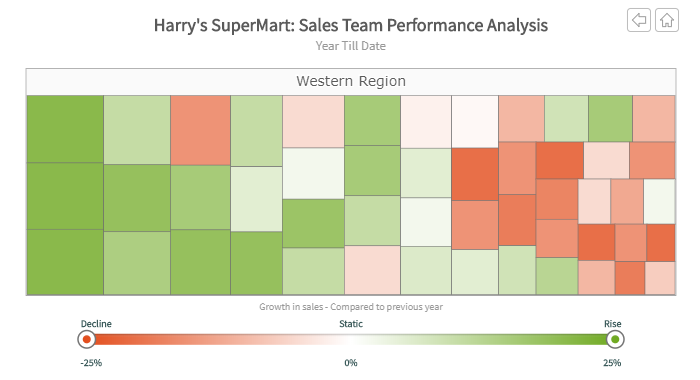
In Treemaps, you can now set a custom height to the navigation bar after drill down, using the navigationBarHeight attribute. Earlier the navigation bar would expand when you drilled down. The chart has been optimized to prevent that issue.
Before Drill Down
After Drill Down
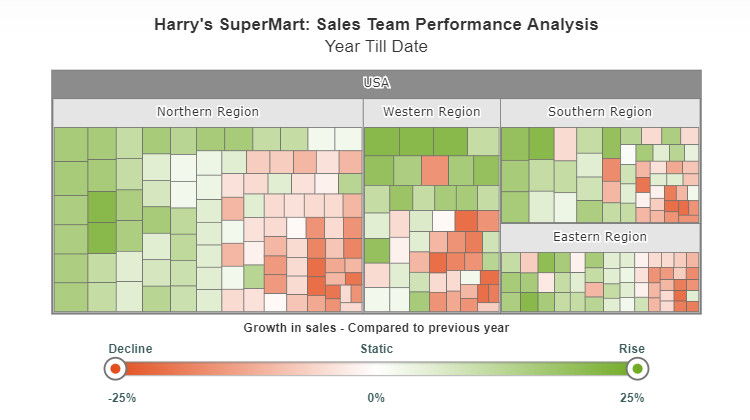
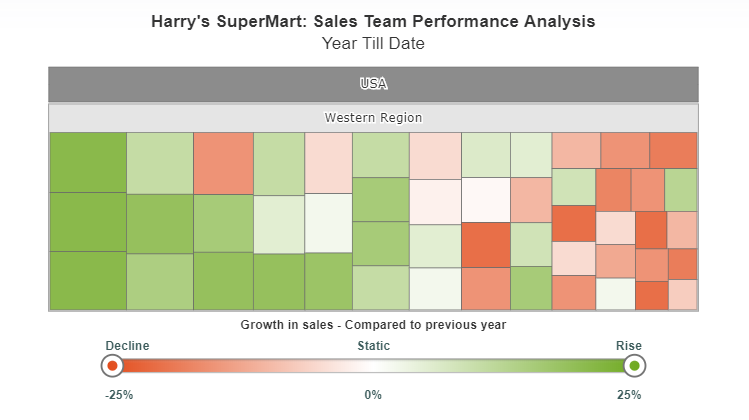
In the screenshots below, you can see how the navigation bar expanded when drill down was performed in earlier versions.
Before Drill Down
After Drill Down
Radar Charts Optimized for Resizing After Using radarRadius
In Radar charts, you can now explicitly mention the value of the radarRadius attribute and then resize the chart without any issue. Previously, when you did this, the long labels and the chart border would be displaced. The chart has been optimized for resizing to ensure that does not happen any longer.
The live chart below displays this behavior:
Scrolling in Box and Whisker Chart
You can now enable scrolling in Box and Whisker charts. Use the numVisiblePlot attribute to set the number of plot points visible on the chart canvas. The scrollbar will automatically appear when there are more plot points than the ones you choose to display on the chart canvas.
The live chart below displays this behavior:
Tooltip Edges in Pie 2D/3D and Doughnut 2D/3D Charts
The edges of the tooltips in Pie and Doughnut (2D/3D) now appear rounded when you set the value of the attribute tooltipBorderRadius.
The live chart below displays this behavior:
Space Management in Pie 2D/Doughnut 2D Charts
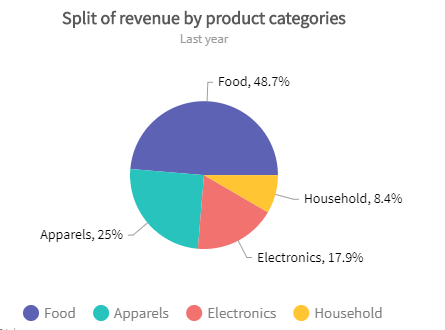
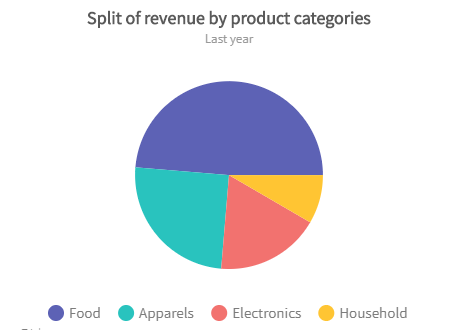
Pie 2D and Doughnut 2D charts now retain their plot size even if you turn off data labels and data values. Earlier the plot would shrink if you turned those off. Space management has been drastically improved now.
The live chart below displays this behavior:
In earlier versions:
With Labels and Values turned on:
With Labels and Values turned off:
Gantt Chart Values Unaffected by Browser Resizing
Previously, in Gantt charts, if you set the width in percentage and used the scrollToDate attribute, the start dates of all charts changed whenever you resized the browser window. The chart has been modified to ensure that the data values are now properly maintained in the above circumstance.
The live chart below displays this behavior: