Loading
Introducing the Treemap Chart
The treemap chart is a visual representation of an information tree created using the tree data structure. It is displayed as 2D nested rectangles, representing the nodes and leaves of the tree data, related to each other.
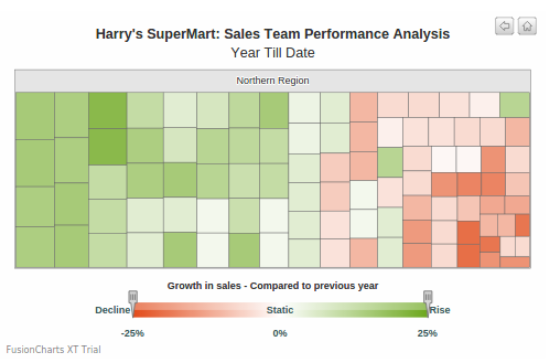
A simple treemap chart is shown below:
This treemap chart compares the sales team’s performance in the present year with their performance in the previous year.
When a rectangle is clicked, the clicked node and its subtree replaces the current root node. For example, when any rectangle (node) in the Northern Region is clicked, the chart view changes to what is shown in the image below:
Click the rectangles in the treemap chart shown above and see how you can traverse through the leaf nodes.
Applications of a Treemap Chart
The treemap chart is primarily used to display hierarchical information that can be represented using the tree structure. Common use-cases represented using the treemap chart include showing the folder structure of a system. It is also used to study patterns and occurrences in a large data set. This is because the colour and the size dimensions are correlated.
Visualization of the Treemap Chart
The treemap chart is modeled based on the tree data structure.
The image below shows how an information tree is translated to the treemap chart.
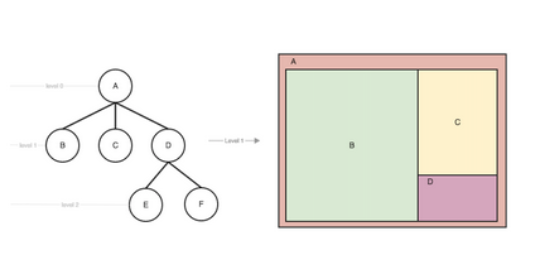
Visualization of the treemap chart should conform to the following pointers:
- Information should be structured in the treemap chart, where it has only one root element.
- The color of a rectangle can represent a dimension, a trend, or a deviation from a key value.
- The leaf node should be the innermost rectangle; the area of this rectangle is proportional to the data value assigned to that leaf.
- Nodes which are not leaves should not be nested; the area of these rectangles is less significant.
- In an ideal treemap implementation, the aspect ratio should come to one.
- The map should utilize maximum space on the screen. If space management is efficiently done, the treemap can be used to plot thousands of items.
Important Concepts Related to the Treemap Chart
Tiling
Tiling is the process of dividing large rectangles into smaller sub-rectangles. Ideally, a treemap tiling algorithm creates rectangles with an aspect ratio that is close to one, with ordering based on the underlying data/information tree.
But these properties have an inverse relationship; there is a tradeoff between the order of placement and the aspect ratio.
When the aspect ratio is optimized, the order of placement becomes less predictable. On the other hand, when the order of placement becomes more stable, the aspect ratio degrades. Therefore tiling algorithms are generally categorized as those that:
-
support low aspect ratio
-
support high stability
-
try to strike a balance between the two
Aspect Ratio
Aspect ratio, especially, for the innermost rectangle is one of the most important constraints in this chart. If the aspect ratio is high, the treemap ends being drawn as thin rectangles, which are tremendously difficult to compare. In the ideal case, where the treemap aspect ratio is expected to be 1, the nested rectangles will be squares that are easy to compare visually. Although, the aspect ratio is never exactly 1 in real-life use-cases, there are algorithms that try to keep it to 1, by trading off the order.
The table below shows the algorithms that are commonly used, also pointing out the relation between the algorithm type and the trade-off points.
| Algorithm | Order | Aspect Ratio |
|---|---|---|
Slice and dice |
Ordered |
Very high |
Squarified |
Unordered |
Lowest |
Other algorithms that can also be used, include:
- Binary tree
- Mixed treemaps
Presently, the FusionCharts Treemap Chart supports only the slice and dice and the squarified algorithms. Support for more algorithms is subject to consideration in the future releases.
Interacting with a Treemap Chart
Interaction Model (as-is)
The basic interaction model for the treemap chart includes:
Left-click: When a rectangle on the treemap is left-clicked, the tree traverses down. The root node changes to the clicked node, plotting only the subtree of the clicked node. If the tree cannot be traversed, the model fails silently.
Right-click: When a rectangle on the treemap is right-clicked, the tree traverses up. The root node is replaced with the node that is its immediate ancestor. If the tree cannot be traversed, the model fails silently.
Hover: When a rectangle on the treemap is hovered over, the action highlights the complete subtree that belongs to that node.
Legend: An optional gradient legend can be incorporated in a treemap chart to filter the nodes.
The FusionCharts Interaction Model for the Treemap Chart
FusionCharts implements the following model for interacting with a treemap chart:
The initial stage:
To drill-down to a leaf node, the user can directly click on that node. For example, when any rectangle (node) in the Northern Region is clicked, the chart view changes to what is shown in the image below:
Now, to go back one level up, the user can either click Northern Region in the header of this view or the  (Back to Parent) button from the top-right corner of the chart.
To go directly back to the initial stage, the user can click  (Back to Top) from the top-right corner of the chart. The resultant view is the initial stage of the chart.