<%@ Language=VBScript %>
<%
'We've included ../Includes/FusionCharts.asp, which contains functions
'to help us easily embed the maps.
%>
<!-- #INCLUDE FILE="../Includes/FusionCharts.asp" -->
<HTML>
<HEAD>
<%
'We've included FusionCharts.js, which helps in JavaScript map embedding.
%>
<script type="text/javascript" language="javascript" src="../../Maps/FusionCharts.js"></script>
</HEAD>
<BODY>
<%
'Declare array to store world population
' we use world map with 8 entities/continents
' this 2 dimensional array will store 8 rows of data for each continent of the map
' first column of each row will store the Internal Id of each entity on the map
' second column will store population data of each entity
dim dataArray(8,2)
'Store population data
dataArray(1,1)="01" ' Internal ID of Asia
dataArray(1,2)="3779000000" ' Asia's population
dataArray(2,1)="02" ' Internal ID of Europe
dataArray(2,2)="727000000"'population
dataArray(3,1)="03"' Internal ID of Africa
dataArray(3,2)="877500000"'population
dataArray(4,1)="04"' Internal ID of North America
dataArray(4,2)="421500000"'population
dataArray(5,1)="05"' Internal ID of South America
dataArray(5,2)="379500000"'population
dataArray(6,1)="06"' Internal ID of Central America
dataArray(6,2)="80200000"'population
dataArray(7,1)="07"' Internal ID of Oceania
dataArray(7,2)="32000000"'population
dataArray(8,1)="08"' Internal ID of Middle East
dataArray(8,2)="179000000"'population
'Declare strXML to store Data String of the map
dim strXML
'Opening MAP element
strXML = "<map borderColor='FFFFFF' fillAlpha='80' showBevel='0' legendPosition='Bottom' >"
'Setting Color ranges : 4 color ranges for population ranges
strXML = strXML & "<colorRange>"
strXML = strXML & "<color minValue='0' maxValue='100000000' displayValue='Population : Below 100 M' color='CC0001' />"
strXML = strXML & "<color minValue='100000000' maxValue='500000000' displayValue='Population :100 - 500 M' color='FFD33A' />"
strXML = strXML & "<color minValue='500000000' maxValue='1000000000' displayValue='Population :500 - 1000 M' color='069F06' />"
strXML = strXML & "<color minValue='1000000000' maxValue='5000000000' displayValue='Population : Above 1000 M' color='ABF456' />"
strXML = strXML & "</colorRange>"
'Opening data element that will store map data
strXML = strXML & "<data>"
'Using Data from array for each entity
FOR i=1 TO ubound(dataArray)
strXML = strXML & "<entity id='" & dataArray(i,1) & "' value='" & dataArray(i,2) & "' />"
NEXT
'closing data element
strXML = strXML & "</data>"
'closing map element
strXML = strXML & "</map>"
'Create the Map - using strXML as Data String;
Call renderChart("../../Maps/FCMap_World8.swf", "", strXML, "firstMap", 750, 460,0,0)
%>
</BODY>
</HTML>
First, we included two files:
- FusionCharts.asp
- FusionCharts.js
<HTML>
<HEAD>
...
<script type="text/javascript" language="javascript" src="../Maps/FusionCharts.js"></script>
...
These two files contain functions to embed the map easily.
Then we declared an array dataArray to store the population data of 8 continents. This is a 2-dimensional array, where the first column stores the Internal ID for all the continets and the second column stores respective population data.
dim dataArray(8,2)
'Store population data
dataArray(1,1)="01" ' Internal ID of Asia
dataArray(1,2)="3779000000" ' Asia's population
dataArray(2,1)="02" ' Internal ID of Europe
dataArray(2,2)="727000000" 'population
dataArray(3,1)="03"' Internal ID of Africa
dataArray(3,2)="877500000"'population
dataArray(4,1)="04"' Internal ID of North America
dataArray(4,2)="421500000"'population
dataArray(5,1)="05"' Internal ID of South America
dataArray(5,2)="379500000"'population
dataArray(6,1)="06"' Internal ID of Central America
dataArray(6,2)="80200000"'population
dataArray(7,1)="07"' Internal ID of Oceania
dataArray(7,2)="32000000"'population
dataArray(8,1)="08"' Internal ID of Middle East
dataArray(8,2)="179000000"'population
We defined a variable strXML to store the entire XML data.
dim strXML
'Opening MAP element
strXML = "<map borderColor='FFFFFF' fillAlpha='80' showBevel='0' legendPosition='Bottom' >"
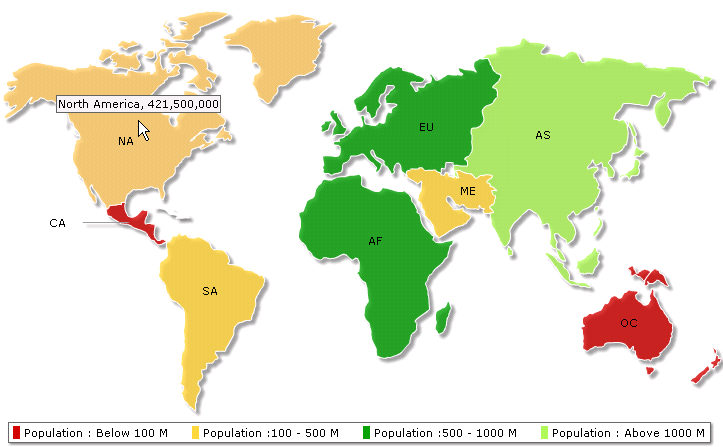
The following code is used to define the color range for the map entities. Different colors show different range of population. The first range is for the regions where population ranges from 0 to 100000000 and it is shown in Red. The second range is for the regions where population ranges from 100000000 to 500000000 and it is shown in Yellow. The third range is from 500000000 to 1000000000 in dark green and the fourth range is 1000000000 and above in light green color.
strXML = strXML & "<colorRange>"
strXML = strXML & "<color minValue='0' maxValue='100000000' displayValue='Population : Below 100 M' color='CC0001' />"
strXML = strXML & "<color minValue='100000000' maxValue='500000000' displayValue='Population :100 - 500 M' color='FFD33A' />"
strXML = strXML & "<color minValue='500000000' maxValue='1000000000' displayValue='Population :500 - 1000 M' color='069F06' />"
strXML = strXML & "<color minValue='1000000000' maxValue='5000000000' displayValue='Population : Above 1000 M' color='ABF456' />"
strXML = strXML & "</colorRange>"
Next we added the map data in <entity> elements by iterating through the array elements. We used for loop for this.
strXML = strXML & "<data>"
'Using Data from array for each entity
FOR i=1 TO ubound(dataArray)
strXML = strXML & "<entity id='" & dataArray(i,1) & "' value='" & dataArray(i,2) & "' />"
NEXT
'closing data element
strXML = strXML & "</data>"
'closing map element
strXML = strXML & "</map>"
Finally we called the function renderChart() from FusionCharts.asp file to render the map.
Call renderChart("../../Maps/FCMap_World8.swf", "", strXML, "firstMap", 750, 460,0,0)
FusionCharts.asp contains the function renderChart(). This helps us create the map simply by passing few parameters in a predefined sequence. The renderChart() function accepts following parameters in the same order as they are presented below:
| Function | Parameter | What it does? |
| renderChart() | see above | Returns a string containing HTML+JavaScript that renders a map. |
| renderChartHTML() | see above | Returns a string containing HTML that renders a map. This function is deprecated. |
| SetTransparentChart() | True or False | When True is passed, this function makes the map ready to create can with transparent background. This work together with the bgAlpha attribute of map which needs to be set to a value lesser than 100. |
| FC_SetDataFormat() | "xml" or "json" | Sets the data format for the data-source of the map. The data-source is set through the dataStr or dataUrl parameter of renderChart or renderChartHTML. The default value is xml. When you set the value to json you need to pass JSON URL or JSON String through dataUrl or dataStr parameter. You need to call this function each time before you call the renderChart or renderChartHTML function. |
| FC_SetRenderer() | "flash" or "javascript" | Sets the renderer-engine of FusionCharts. It can be flash (default value). When you set the value to javascript, you can force-set javascript renderer. You need to call this function each time before you call renderChart function. This setting is not applicable while using the renderChartHTML function. |
| FC_EnablePrintManager() | This function helps you enable the managed print feature of FusionCharts for Mozilla- browsers. It returns a <script> tag . You need to write the string in your page.You need to call this only once in a page. | |
| FC_SetWindowMode() | "window" or "transparent" or "opaque" | Sets window mode of a map. By default, map renders in "opaque" mode. You can set to it "window" if you required. You need to call this function each time before you call renderChart or renderChartHTML function. |
Below is the screenshot of the map used for this example.
Existing users: Use of FusionMaps.asp is deprecated. Use FusionCharts.asp instead. However, after upgrading to FusionMaps XT, your existing implementations using FusionMaps.asp will continue to work without any problem.