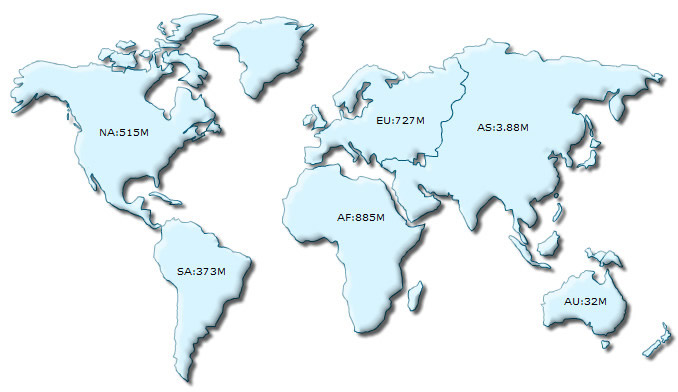
To get you started with FusionMaps XT, we will show you how to build a World Map to show the Population Distribution across continents. Once completed, the map will look as under (with animation and interactivity, which is not reflected by the image below):
If you're a non-technical user and want to generate maps without using any programs or scripts, you can switch to the Quick Map Configuration > Using Visual Map Builder page, where we explain how to visually configure and generate a data-driven map, without getting into any programming.
Code examples discussed in this section are present in Download Package > Code > MyFirstMap folder.
Follow the steps below to get started:
- Create a folder LearningFusionMapsXT on your hard-drive. We will use this folder as the root folder for building all FusionMaps XT examples.
- Create a folder named MyFirstMap inside the above folder. Inside the MyFirstMap folder, create a folder named Maps.
- Copy FCMap_World.swf and FusionCharts.HC.world.js from Download Pack > Maps folder to MyFirstMap > Maps folder.
- Copy FusionCharts.js, FusionCharts.HC.js, FusionCharts.HC.Maps.js and jquery.min.js files from Download Pack > Maps folder to MyFirstMap > Maps folder.
- Create an XML file » (Creating an XML file is as easy as creating a text file using Windows Notepad or any other text editor. It is actually a plain text file with extension - xml) in MyFirstMap folder with name Data.xml.
- Copy the code given below (left) to Data.xml file. It is the XML-lized form of the Population data shown in the table (right).
<map borderColor='005879' fillColor='D7F4FF' numberSuffix='M' includeValueInLabels='1' labelSepChar=':' baseFontSize='9'>
     <data>
        <entity id='NA' value='515' />
        <entity id='SA' value='373'/>
        <entity id='AS' value='3875' />
        <entity id='EU' value='727' />
        <entity id='AF' value='885' />
        <entity id='AU' value='32' />
     </data>
</map>
Continents Population (in Millions) North America 515 South America 373 Europe 727 Asia 3875 Africa 885 Australia 32 - Create an HTML file (using a text editor like Notepad, TextMate etc. or the Web Development software you use) in MyFirstMap folder and copy-paste the code given below and save it as FirstMap.html:
<html>
  <head>
    <title>My First map using FusionCharts JavaScript Class</title>
    <script type="text/javascript" src="Maps/FusionCharts.js"></script>
  </head>
  <body>
    <div id="mapContainer">FusionMaps XT will load here!</div>
    <script type="text/javascript"><!--

    var myMap = new FusionCharts ("Maps/FCMap_World.swf", "MyMapId", "750", "400", "0");
      myMap.setXMLUrl ("Data.xml");
      myMap.render("mapContainer");
    // -->
    </script>
  </body>
</html>
And that completes the recipe!
Open the file FirstMap.html in a Web Browser » Internet Explorer, Firefox, Opera or Safari (Mac/iPhone/iPad/Windows) and you will see an animated World Map similar to the one below:
See it live!
Rendering the map as JavaScript: The same code can render the map as JavaScript. You just have to remove the .swf from the file name and the path of the swf file from the existing code. The modified code will look like var myMap = new FusionCharts ("World", "MyMapId", "750", "400", "0");. This code will render a JavaScript World map. Click here to see the complete code and a live example.
Now that you've already created a map, let's get behind the scenes and understand how FusionMaps XT renders maps in a web-page. Essentially, to create a map, you need the following four items:
- Map SWF files: Each map in FusionMaps XT is an SWF file that creates a specific type of map. So, if you want to create World Map, you'll need the SWF file called FCMap_World.swf. Similarly for creating an Asia Map you'll need FCMap_Asia.swf. For the complete list of map SWF files, refer to the List of Maps. The map SWF file is loaded and rendered using Adobe Flash player plug-in that is installed on your machine (more specifically, browser).
- Map data: FusionMaps XT data file contains both data for plotting and cosmetic/functional configuration for the map. FusionMaps XT accepts data in XML and JSON format. The XML or JSON data document can either be produced manually or generated using server-side scripts that are connected to your databases or live data sources. In the above example, we have used a hand-coded XML file for plotting the map.
- JavaScript class files: These are also present in the Maps folder in the root of the Download Package. The JavaScript class files help in rendering maps.
- HTML wrapper file (or a dynamic web page): The HTML wrapper file is where the maps are rendered. This file contains the code which integrates all other components (discussed above) to produce the maps.
What happens if Flash player is not available?
In case Flash Player is not available on certain devices (like iPad/iPhone), the FusionCharts JavaScript library automatically renders the same chart using JavaScript. For iPhone/iPad you do not need to modify anything to enable this. However, for other browsers without Flash Player or if you wish to use pure JavaScript-only maps, you can also explicitly render JavaScript maps.
Let's take a closer look at the data and its XML form:
<map borderColor='005879' fillColor='D7F4FF' numberSuffix='M' includeValueInLabels='1' labelSepChar=':' baseFontSize='9'>
     <data>
        <entity id='NA' value='515' />
        <entity id='SA' value='373'/>
        <entity id='AS' value='3875' />
        <entity id='EU' value='727' />
        <entity id='AF' value='885' />
        <entity id='AU' value='32' />
     </data>
</map> |
|
Basically, what we have done above can be listed in the following points:
- We have created the root <map> element.
- A number of cosmetic attributes like border color of the map, fill color, number suffix (to be added at the end of every number), a flag to include data values in map labels, the label separator character and font size attributes are used.
- Immediately inside the <map> element, we've defined <data> element, whose child nodes contain the actual data for each continent.
- To define data for each continent on the map, an <entity> element is added as <entity id='NA' value='515' />.
- The id here corresponds to the internal Id of the continent or entity.
Internal ID helps in identifying each part of a map uniquely. Each map in FusionMaps XT Pack is divided into a number of entities, representing a unit zone on the map. For this World map, each continent is an entity. Each entity in a map has an internal Id, using which, data (like tool tip, value, color etc.) related to that entity is passed. The internal Ids (along with name and short name) of all the entities of each map are listed in the section Map Specification Sheet as reference).
- value denotes the population which we want to show on the map.
A Map Specification sheet provides a complete list of the Internal Id, Short Names and the Long Names associated with a particular map. Click here to view the map specification sheet of the world map.
Just as a measure to check if the XML document is structurally valid, open the file in your browser. You should be able to see the XML data document in a formatted way, without any errors.Note that you can also provide map data in JSON format. You can view an example of JSON data here. Or, to learn more about FusionMaps XT JSON data format, please go through FusionMaps XT data formats > JSON section.
The Entities table for the world Map is reproduced below (from the World Map Specification Sheet).
| Internal Id | Entity Short Name | Entity Long Name |
| NA | NA | North America |
| SA | SA | South America |
| EU | EU | Europe |
| AS | AS | Asia |
| AF | AF | Africa |
| AU | AU | Australia |
As you can see above, each entity on the map has three properties:
- Internal Id (Entity Id) through which we refer to that entity in the XML data document.
- Short Name of the entity which gets displayed on the map.
- Full Name of the entity, which by default is shown as tool tip for the entity. You can also opt to show full name on the map instead of short name.
You can define your own IDs, short names and long names for each entity. To know more click here.
In the HTML wrapper file (or your web page), the shots are called by the included JavaScript class file FusionCharts.js. Let's take a second look at the HTML code to gain an understanding of how it works.
<html>
  <head>
    <title>My First map using FusionCharts JavaScript Class</title>
    <script type="text/javascript" src="Maps/FusionCharts.js"></script>
  </head>
  <body>
    <div id="mapContainer">FusionMaps XT will load here!</div>
    <script type="text/javascript"><!--
      var myMap = new FusionCharts ("Maps/FCMap_World.swf", "MyMapId", "750", "400", "0");
      myMap.setXMLUrl ("Data.xml");
      myMap.render("mapContainer");
    // -->
    </script>
  </body>
</html>
In the very beginning, the JavaScript class file FusionCharts.js is included into the HTML using the code shown below. The FusionCharts.js is smart enough to automatically load the other required JavaScript files - jquery.min.js, FusionCharts.HC.js, FusionCharts.HC.Maps.js and FusionCharts.HC.world.js on-demand.
<script type="text/javascript" src="Maps/FusionCharts.js"></script>
Existing users: You might be wondering what happened to FusionMaps.js which you have been using in your application. Starting FusionMaps XT, use of FusionMaps.js is deprecated. Use FusionCharts.js instead. But, although deprecated, to ease your upgrade process to FusionMaps XT, we have provided a new FusionMaps.js in FusionMaps XT pack's > Maps folder. This FusionMaps.js will help in loading FusionCharts.js (located in the same folder as FusionMaps.js) and all related JavaScript files in your application. However, we recommend that you replace all references to FusionMaps.js to FusionCharts.js in your code.
<div id="mapContainer">FusionMaps XT will load here!</div>
Now comes the essential part, which instantiates the map. This is called the map constructor.
var myMap = new FusionCharts( "Maps/FCMap_World.swf", "myMapId", "750", "400", "0" );
Here, myMap is the name of the JavaScript object (variable) that contains reference to the map.
The following parameters are passed on to the myMap object:
- URL of SWF file of the map type that we intend to use. Maps/FCMap_World.swf in this example as FCMap_World.swf is the name of SWF and it is contained in a relative path inside Maps folder.
- ID of the map. You can give any ID for the map. Just make sure
that if you're using multiple maps in the same HTML page, each map
should have a unique ID. In our example above, we provide "myMapId" as the ID.
To provide cross-browser compatibility, we recommend you not to start the ID with a numerical value, nor use space as part of the ID.
- Required width and height of the map. When providing in pixels, just give the numeric value (without px).
- debugMode parameter. The debugMode is set to "0" (off) normally except for when debugging is required. This has been explained in detail in the Chart Parameters section on the FusionCharts JavaScript API - Functions page.
Existing users: You might be wondering what happened to the sixth parameter - registerWithJS that comes after debugMode. Starting FusionMaps XT, use of registerWithJS is deprecated. It is always set to 1 internally. Although deprecated, you can continue to use this parameter in your existing code without any problem.
The code below provides the reference (relative URL) of map data file (XML in this case). The path of the XML file is set using setXMLUrl() function as shown below:
myMap.setXMLUrl( "Data.xml" );
The code sample above uses URL of static XML file. Ideally, you would not use a physical data file. Instead you will have your own server side scripts to use dynamic data and build XML. You can always provide the URL of the script to virtually relay the dynamically built data.
Finally, the render() method is called and the ID of HTML DIV, where the map is meant to be rendered, is provided. This line of code renders the desired map inside the DIV.
myMap.render( "mapContainer" );
Important Note: The map ID as well as the ID of the DIV element (or any HTML element where a map is meant to be rendered) should be unique. Also, if you are using global variables to store the JavaScript references of maps, make sure that the name of each such variable is unique. The map ID, the HTML element ID and the JavaScript variable name should not conflict with each other.
Existing users: You might be wondering what happened to the functions like setDataURL()which you have already been using in your application. Yes - although deprecated, it will continue to work without any problem.
Since FusionMaps XT, alternate methods of declaring and rendering a map using JavaScript are also available.
You can use a compact single-line of JavaScript (instead of the three lines we saw in the above sample) to render a map as shown below:
<html>
  <head>
    <title>My First map using FusionCharts JavaScript Class</title>
    <script type="text/javascript" src="Maps/FusionCharts.js"></script>
  </head>
  <body>
    <div id="mapContainer">FusionMaps XT will load here!</div>
    <script type="text/javascript"><!--

        var myMap = FusionCharts.render( "Maps/FCMap_World.swf",
            "myMapId", "750", "400", "mapContainer", "Data.xml" );

	   // -->
	  </script>
  </body>
</html>
See it live!
There are additional ways of rendering a map as well, which have been explained in Creating maps page in "FusionMaps XT and JavaScript" section.
If for any reason, you do not see a map, run through the following checks:
If you see an endless loading progress bar in your browser, or if the right click menu (right click at the place where the map is supposed to be) shows "Movie not loaded", check the following:
- Have you pasted the map SWF (FCMap_World.swf), map JavaScript file (FusionCharts.HC.world.js) and the other JavaScript files (FusionCharts.js, FusionCharts.HC.js, FusionCharts.HC.Maps.js and jquery.min.js) in the Maps folder of MyFirstMap folder?
- Have you provided the SWF path properly in your FirstMap.html page?
If you get an "Error in Loading Data." message, check the following:
- Whether Data.xml is in the same folder as the FirstMap.html HTML file?
- Whether Data.xml is named as Data.xml and not Data.xml.txt (as many basic text editors append .txt after the file name)
- Whether your map files (SWF and JavaScript) and XML/JSON data are on the same sub-domain. Cross domain data loading is not allowed.
If you get an "Invalid Data." message, it means that the XML/JSON data is malformed. Check it again for common errors like:
- Presence of duplicate attributes in the XML/JSON.
- Difference in case of tags. <map> should end with </map> and not </Map> or </MAP>.
- Missing opening/closing quotation marks for any attributes. e.g., <map borderColor=005879'should be <map borderColor='005879'.
- Missing closing tag for any element.
To check whether your final XML is ok, open it in your browser and you'll see the error.
If only the text "FusionMaps XT will load here!" is displayed, check with the following:
- Have you pasted the FusionCharts.js, jquery.min.js, FusionCharts.HC.js, FusionCharts.HC.Maps.jsand FusionCharts.HC.world.js files in Maps folder of MyFirstMap folder?
- Have you included and provided the path of FusionCharts.js properly in your FirstMap.html page?
- Are there any JavaScript syntax or runtime errors that might have halted the execution of FusionCharts APIs?
- Have you given unique names for the map's JavaScript variable, map's ID and the HMTL DIV's ID?
To provide cross-browser compatibility, we recommend you not to start the ID with a numerical value, nor use space as part of the ID.