FusionCharts for Flex > Your First Chart > Handling Events
FusionCharts exposes various events like load, render, click etc. and allows you to declare event listeners to trap these events. Adding an event listener is a three step process. In order to add an event listener simply follow the steps listed below:
- Register a new event listener with the FusionCharts object in the MXML file.
- Create the event handler method for that event listener.
- If needed, set the appropriate properties in the data XML to be linked with the event.
In the code-snippet below, we register a new event listener using FCClickEvent attribute. This event is triggered when a chart data element is cliicked. The event handler method clicked is also created.
<?xml version="1.0" encoding="utf-8"?>
<s:Application xmlns:fx="http://ns.adobe.com/mxml/2009"
			   xmlns:s="library://ns.adobe.com/flex/spark"
			   xmlns:mx="library://ns.adobe.com/flex/mx" xmlns:components="com.fusioncharts.components.*">

	<components:FusionCharts id="FC1" FCChartType="Column3D" FCDataURL="Data.xml" FCClickEvent="clicked(event)"/>

		<fx:Script>
			<![CDATA[

				import com.events.FCEvent;
				import mx.controls.Alert;
				private function clicked(e:FCEvent):void {
					Alert.show(e.param);
				}

			]]>
		</fx:Script>

</s:Application>
To fire this event, we need to specially set up the link attribute releted to the dataplot (like we had set in the previous page to achieve drill-down feature). We again modify the exsiting data for Simple Sales Chart as shown below:
<chart caption='Half Yearly Sales Summary' subcaption='For the year 2008 - First Half'
		 xAxisName='Month' yAxisName='Sales' numberPrefix='$'>
   <set label='Jan' value='17400' link="S-label 1" />
   <set label='Feb' value='19800' link="S-label 2" />
   <set label='Mar' value='21800' link="S-label 3" />
   <set label='Apr' value='23000' link="S-label 4" />
   <set label='May' value='29000' link="S-label 5" />
   <set label='June' value='27600' link="S-label 6" />
</chart>
We add the link attribute to the data source. If a data-plot's link is defined with a S- prefix the data-plot becomes a special hotspot, which can be trapped by event-listeners. When a data-plot is clicked an event named FCClickEvent is triggered. You can pass any value after S-, the value would be passed as a parameter of the event handler method. A developer can use this value to take further actions for drill-down etc.. Here, we invoke a message box using the value. We pass a distinct value for each data-plot. It will be triggered when the end viewer clicks on any of the data-plots.
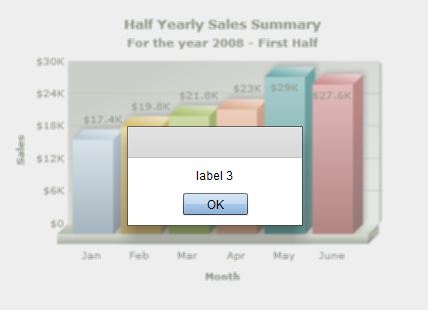
Once the chart renders, if you click on a column, say, column labeled 'Mar', the FCClickEvent would be invoked. This in turn would call the clicked method and pass Label 3 as the parameter. The parameter which is passed to the method will be displayed in a message box using Alert.show().
The image below shows the alert box that appears when the column labeled 'Mar' is clicked. You can try clicking other columns to get different results.

Please refer to FusionCharts Events page in "Chart API Reference" section for more information on chart Events.