FusionCharts for Flex > Your First Chart > Adding Style
FusionCharts for Flex allows you to add styles to your chart. Styles offer a simplistic approach to enhance the appearance of a chart. For each defined object on a chart, you can apply one or more styles like animation, bevel, blur, font, shadow, and glow.
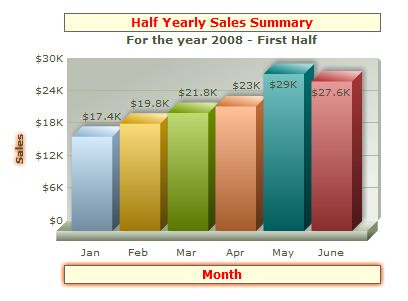
Let us see how we can apply FONT and GLOW styles to CAPTION, XAXISNAME, and YAXISNAME objects of our simple sales chart. For simplicity, we define and apply the styles in our "Simple Sales Chart" XML. You can also define and apply styles using other data types too. We would cover those in later sections. Let us see where in the XML we add the style configurations:
<chart caption='Half Yearly Sales Summary' subcaption='For the year 2008 - First Half'
   xAxisName='Month' yAxisName='Sales' numberPrefix='$'>
   <set label='Jan' value='17400' />
   <set label='Feb' value='19800' />
   <set label='Mar' value='21800' />
   <set label='Apr' value='23000' />
   <set label='May' value='29000' />
   <set label='June' value='27600' />

   <styles>
      <definition>
         <style name='MyFirstFontStyle' type='font' font='Verdana' size='12' color='FF0000'
		 bgColor='FFFFDD' borderColor='666666'  />
         <style name='MyFirstGlow' type='Glow' color='FF5904' alpha='75'  />
      </definition>
      <application>
         <apply toObject='CAPTION' styles='MyFirstFontStyle'/>
         <apply toObject='XAXISNAME' styles='MyFirstGlow,MyFirstFontStyle'  />
         <apply toObject='YAXISNAME' styles='MyFirstGlow'  />
      </application>
   </styles>

</chart>
Please refer to FusionCharts and XML > Chart Styles XML section for more information on Styles.
When the charts renders, you'll find that style configurations applied as shown in the image below:
