| Event Name | Description |
| FCClickEvent | Whenever a user clicks on a dataplot, which has link attribute that starts with 'S-', this event is triggered. |
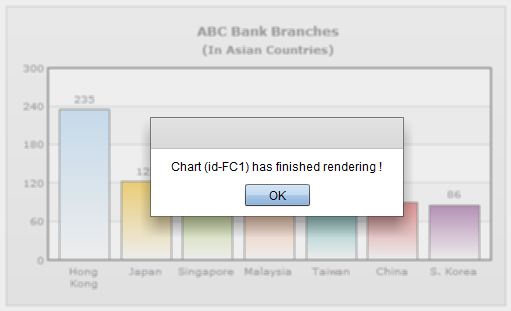
| FCRenderEvent | When the chart finishes rendering, this event is triggered. |
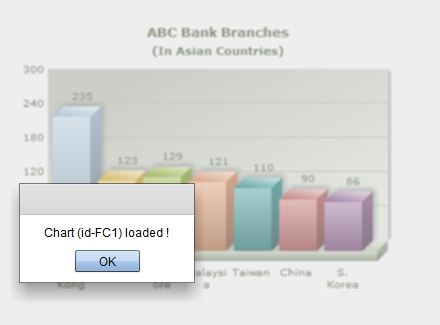
| FCLoadEvent | This event is triggered after the chart data gets loaded completely before rendering starts. |
| FCErrorEvent | The event is triggered when an error is generated. |
| FCExported | This event is generated after the completetion of the image export process. |
| FCDataLoadedEvent | The event is dispatched after the chart data is loaded. The event is independent of the data source viz. FCData, FCDataXML, FCDataURL. |
| FCDataLoadErrorEvent | This event is dispathched if the chart fails to load data. Generally caused due to invalid or empty data sources. |
| FCDataXMLInvalidEvent | This event is generated if the data source does not conform to FusionCharts XML. |
| FCNoDataToDisplayEvent | Whenever the dataset consists of just the root element without any additional data, this event is generated. |
Please note that to trap these events one needs to import com.events.FCEvent class:
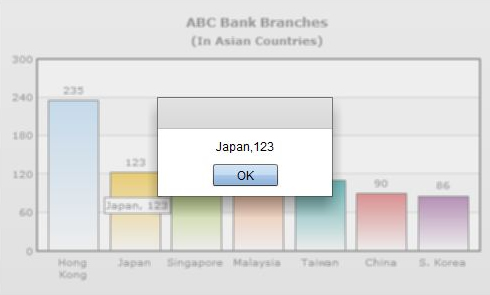
When a dataplot's link is defined with a 'S-' prefix the dataplot becomes a hotspot, which can be trapped by FCClickEvent event. You can pass any value after 'S-' that would be passed as a parameter of the event listener function. Thus a developer can use this value to setup further actions for drilldown. For example, you can invoke a message box with a distinct value for each dataplot, when the end viewer clicks on each dataplot on the chart.
Let's take an example to demonstrate how to trap this event. Let us create a simple 2D Column chart indicating 'ABC Bank Branches' in Asia. Each column when clicked, would pass its label and value to the event listener function, which (for the sake of demonstration) would just write it out in an alert box.
The actions in the new project would now contain the following:
<?xml version="1.0" encoding="utf-8"?>
<s:Application xmlns:fx="http://ns.adobe.com/mxml/2009"
xmlns:s="library://ns.adobe.com/flex/spark"
xmlns:mx="library://ns.adobe.com/flex/mx"
xmlns:components="com.fusioncharts.components.*"
initialize="initApp()">
<components:FusionCharts id="FC1" x="10" y="10" FCChartType="Column2D" FCDataURL="chartData.xml" width="500" height="300" />
<fx:Script>
<![CDATA[
import com.events.FCEvent;
import mx.collections.ArrayCollection;
import mx.controls.Alert;
// This function is invoked when the project swf gets initialized.
private function initApp():void
{
// Register the event listener to track mouse click on those chart dataplots
// Which have "S-" prefix
// Whenever a dataplot with "S-" prefix is clicked
// "clicked" function would be called
FC1.addEventListener("FCClickEvent",clicked);
}
// As registered in the above addEventLister, whenever
// mouse click occured in a pre-defined linked data object,
// the function below is invoked
// It accepts a parameter of FCEvent type
private function clicked(e:FCEvent):void
{
//The value is passed as param property of the parameter object
Alert.show(e.param);
}
]]>
</fx:Script>
</s:Application>
<set label='Hong Kong' value='235' link='S-Hong Kong,235'/>
<set label='Japan' value='123' link='S-Japan,123'/>
<set label='Singapore' value='129' link='S-Singapore,129'/>
<set label='Malaysia' value='121' link='S-Malayasia,121'/>
<set label='Taiwan' value='110' link='S-Taiwan, 110'/>
<set label='China' value='90' link='S-China, 90'/>
<set label='S. Korea' value='86' link='S-S. Korea, 86'/>
</chart>
As you can see above, the initApp() function executes when application initializes. We have added an event listener to trap FCClickEvent event. When this event is raised by clicking those dataplots, which has link value defined with a 'S-' prefix, the function clicked is called. The value that is passed after each 'S-' in the link attribute is passed as the eventListener function parameter. We define clicked function to access the parameter value from e.param and show it in an Alert popup.
Now, if you run this code and then click on any data element, the following figure will be displayed:

<?xml version="1.0" encoding="utf-8"?>
<s:Application xmlns:fx="http://ns.adobe.com/mxml/2009"
xmlns:s="library://ns.adobe.com/flex/spark"
xmlns:mx="library://ns.adobe.com/flex/mx"
xmlns:components="com.fusioncharts.components.*"
initialize="initApp()">
<components:FusionCharts id="FC1" x="10" y="10" FCChartType="Column2D" FCDataURL="Data.xml"/>
<fx:Script>
<![CDATA[
import com.events.FCEvent;
import mx.controls.Alert;
private function initApp():void
{
FC1.addEventListener("FCRenderEvent",rendered);
}
// Whenever the specific chart gets rendered completely,
// the following function is invoked
private function rendered(e:FCEvent):void
{
Alert.show("Chart (id-"+e.target.name+") has finished rendering !");
}
]]>
</fx:Script>
</s:Application>

<?xml version="1.0" encoding="utf-8"?>
<s:Application xmlns:fx="http://ns.adobe.com/mxml/2009"
xmlns:s="library://ns.adobe.com/flex/spark"
xmlns:mx="library://ns.adobe.com/flex/mx"
xmlns:components="com.fusioncharts.components.*"
initialize="initApp()">
<components:FusionCharts id="FC1" x="10" y="10" FCChartType="Column3D" FCDataURL="chartData.xml"/>
<fx:Script>
<![CDATA[
import com.events.FCEvent;
import mx.controls.Alert;
// This function is invoked after the project swf gets initialized.
// Here we register the listener to track the loading of the chart in flex swf
private function initApp():void
{
FC1.addEventListener("FCLoadEvent",loded);
}
// Whenever the specific chart gets loaded completely,
// the following function is invoked
private function loded(e:FCEvent):void
{
Alert.show("Chart (id-"+e.target.id+") loaded !");
}
]]>
</fx:Script>
</s:Application>

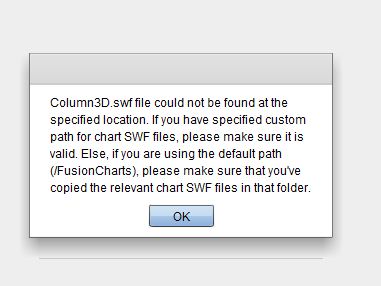
This event is triggered when an error occurs while rendering the chart. Like our previous examples, we capture the event using an event listener, and finally throw a message.
The MXML file would be as following:
<?xml version="1.0" encoding="utf-8"?>
<s:Application xmlns:fx="http://ns.adobe.com/mxml/2009"
xmlns:s="library://ns.adobe.com/flex/spark"
xmlns:mx="library://ns.adobe.com/flex/mx"
xmlns:components="com.fusioncharts.components.*"
initialize="initApp()">
<components:FusionCharts id="FC1" x="10" y="10" FCChartType="Column3D" FCDataURL="Data.xml" FCFolder="illegalPath"/>
<fx:Script>
<![CDATA[
import com.events.FCEvent;
import mx.collections.ArrayCollection;
import mx.controls.Alert;
// Upon initiation, an error-handler function is attached
// to the FCErrorEvent of FusionCharts FC1 object
private function initApp():void
{
FC1.addEventListener("FCErrorEvent",errorHandler);
}
// The errorHandler function receives a FusionCharts event
// and alerts it's parameters to the user
private function errorHandler(e:FCEvent):void
{
Alert.show(e.param);
}
]]>
</fx:Script>
</s:Application>
As you can see in the code above, we caught the FCErrorEvent event using an event listener, named errorHandler. In the above code the FCFolder parameter is given a wrong value. If you run the above code, you will get the following result:
