Loading
Configuring the Treemap Chart
FusionCharts Suite XT includes attributes that you let you customize the appearance and functionality of your treemap chart.
In this section, you will be shown how you can:
- Set the tiling algorithm
- Customize the parent and leaf nodes
- Customize the base font
- Customize the label effects
- Configure the glow effect
- Customize data plots
- Render the legend
Setting the Tiling Algorithm for the Treemap Chart
The tiling algorithm affects how the larger rectangles are divided into smaller sub-rectangles, thus affecting how the chart looks like. FusionCharts supports the following two algorithms:
- Slice and dice
- Squarified
The chart below is rendered using the slice and dice algorithm, which is the default algorithm:
Click the rectangles in each chart to traverse through the chart and see how the chart view changes.
The chart below is rendered using the squarified algorithm:
Given below is a brief description of the attribute used to set the algorithm:
| Attribute Name | Description |
|---|---|
|
Takes sliceanddice (default) or squarified as values to set the tiling algorithm. |
The data structure to render the treemap chart with the squarified algorithm is given below:
{
    "chart": {
        "plotborderfillcolor": "fff",
        "plotborderthickness": "0",
        "animation": "0",
        "labelGlow": "0",
        "horizontalPadding": "1",
        "verticalPadding": "1",
        "caption": "Harry's SuperMart: Product-wise Revenue",
        "subcaption": "Previous Year",
        "algorithm": "squarified"
    },
    "data": [
        {
            "label": "Harry's SuperMart",
            "value": "1000",
            "fontcolor": "fff",
            "fillcolor": "#303030",
            "data": [
                {
                    "label": "Food Products",
                    "value": "400",
                    "fontcolor": "fff",
                    "fillcolor": "#527a7a",
                    "data": [
                        {
                            "label": "Dairy",
                            "value": "80",
                            "fillcolor": "#99ffcc"
                        },
                        {
                            "label": "Cereals",
                            "value": "70",
                            "fillcolor": "#e5fff2"
                        },
                        {
                            "label": "Poultry",
                            "value": "150",
                            "fillcolor": "#00cc66"
                        },
                        {
                            "label": "Vegetables",
                            "value": "100",
                            "fillcolor": "#33ff99"
                        }
                    ]
                },
                {
                    "label": "Non-food Products",
                    "value": "600",
                    "fontcolor": "fff",
                    "fillcolor": "#404040",
                    "data": [
                        {
                            "label": "Apparel",
                            "value": "400",
                            "fontcolor": "fff",
                            "fillcolor": "#666",
                            "data": [
                                {
                                    "label": "Men's Wear",
                                    "value": "150",
                                    "fillcolor": "ff8080"
                                },
                                {
                                    "label": "Women's Wear",
                                    "value": "200",
                                    "fillcolor": "#ff6666"
                                },
                                {
                                    "label": "Children's Wear",
                                    "value": "50",
                                    "fillcolor": "#ffcccc"
                                }
                            ]
                        },
                        {
                            "label": "Kitchenware",
                            "value": "150",
                            "fillcolor": "#e6b3ff"
                        },
                        {
                            "label": "Electronics",
                            "value": "50",
                            "fillcolor": "#eeccff"
                        }
                    ]
                }
            ]
        }
    ]
}
Customizing the Parent and Leaf Nodes
A treemap chart customized to hide the parent nodes and show only the leaf nodes is shown below:
Given below is a brief description of the attributes that can be used to customize the parent and leaf nodes:
| Attribute Name | Description |
|---|---|
|
Set this attribute to |
|
Groups all the leaf nodes belonging to a parent node, visualizing them as a masked unit when the mouse pointer is hovered over any one of the leaf nodes. Set this attribute to |
|
Hex code for setting a single background color for all parent nodes |
The data structure to render the above shown treemap chart is given below:
{
    "chart": {
        "plotborderfillcolor": "fff",
        "plotborderthickness": "0",
        "animation": "0",
        "labelGlow": "0",
        "horizontalPadding": "1",
        "verticalPadding": "1",
        "caption": "Harry's SuperMart: Product-wise Revenue",
        "subcaption": "Previous Year",
        "showParent": "0"
    },
    "data": [
        {
            "label": "Harry's SuperMart",
            "value": "1000",
            "fontcolor": "fff",
            "fillcolor": "#303030",
            "data": [
                {
                    "label": "Food Products",
                    "value": "400",
                    "fontcolor": "fff",
                    "fillcolor": "#527a7a",
                    "data": [
                        {
                            "label": "Dairy",
                            "value": "80",
                            "fillcolor": "#99ffcc"
                        },
                        {
                            "label": "Cereals",
                            "value": "70",
                            "fillcolor": "#e5fff2"
                        },
                        {
                            "label": "Poultry",
                            "value": "150",
                            "fillcolor": "#00cc66"
                        },
                        {
                            "label": "Vegetables",
                            "value": "100",
                            "fillcolor": "#33ff99"
                        }
                    ]
                },
                {
                    "label": "Non-food Products",
                    "value": "600",
                    "fontcolor": "fff",
                    "fillcolor": "#404040",
                    "data": [
                        {
                            "label": "Apparel",
                            "value": "400",
                            "fontcolor": "fff",
                            "fillcolor": "#666",
                            "data": [
                                {
                                    "label": "Men's Wear",
                                    "value": "150",
                                    "fillcolor": "ff8080"
                                },
                                {
                                    "label": "Women's Wear",
                                    "value": "200",
                                    "fillcolor": "#ff6666"
                                },
                                {
                                    "label": "Children's Wear",
                                    "value": "50",
                                    "fillcolor": "#ffcccc"
                                }
                            ]
                        },
                        {
                            "label": "Kitchenware",
                            "value": "150",
                            "fillcolor": "#e6b3ff"
                        },
                        {
                            "label": "Electronics",
                            "value": "50",
                            "fillcolor": "#eeccff"
                        }
                    ]
                }
            ]
        }
    ]
}
Customizing the Base Font
The base font customization attributes affect the font properties of all text that is rendered within the chart canvas.
A treemap chart with the base font customized is shown below:
Given below is a brief description of a the attributes that can be used to customize the base font:
| Attribute Name | Description |
|---|---|
|
Sets the font family for the text |
|
Sets the font size for the text |
|
Sets the hex code for the text color |
The data structure to render the above shown treemap chart is given below:
{
    "chart": {
        "plotborderfillcolor": "fff",
        "plotborderthickness": "0",
        "animation": "0",
        "labelGlow": "0",
        "horizontalPadding": "1",
        "verticalPadding": "1",
        "caption": "Harry's SuperMart: Product-wise Revenue",
        "subcaption": "Previous Year",
        "baseFont": "Verdana",
        "baseFontSize": "14",
        "baseFontColor": "#990099"
    },
    "data": [
        {
            "label": "Harry's SuperMart",
            "value": "1000",
            "fontcolor": "fff",
            "fillcolor": "#303030",
            "data": [
                {
                    "label": "Food Products",
                    "value": "400",
                    "fontcolor": "fff",
                    "fillcolor": "#527a7a",
                    "data": [
                        {
                            "label": "Dairy",
                            "value": "80",
                            "fillcolor": "#99ffcc"
                        },
                        {
                            "label": "Cereals",
                            "value": "70",
                            "fillcolor": "#e5fff2"
                        },
                        {
                            "label": "Poultry",
                            "value": "150",
                            "fillcolor": "#00cc66"
                        },
                        {
                            "label": "Vegetables",
                            "value": "100",
                            "fillcolor": "#33ff99"
                        }
                    ]
                },
                {
                    "label": "Non-food Products",
                    "value": "600",
                    "fontcolor": "fff",
                    "fillcolor": "#404040",
                    "data": [
                        {
                            "label": "Apparel",
                            "value": "400",
                            "fontcolor": "fff",
                            "fillcolor": "#666",
                            "data": [
                                {
                                    "label": "Men's Wear",
                                    "value": "150",
                                    "fillcolor": "ff8080"
                                },
                                {
                                    "label": "Women's Wear",
                                    "value": "200",
                                    "fillcolor": "#ff6666"
                                },
                                {
                                    "label": "Children's Wear",
                                    "value": "50",
                                    "fillcolor": "#ffcccc"
                                }
                            ]
                        },
                        {
                            "label": "Kitchenware",
                            "value": "150",
                            "fillcolor": "#e6b3ff"
                        },
                        {
                            "label": "Electronics",
                            "value": "50",
                            "fillcolor": "#eeccff"
                        }
                    ]
                }
            ]
        }
    ]
}
Customizing the Label Font on a Treemap Chart
A treemap chart with the labels customized is shown below:
Given below is a brief description of a the attributes that can be used to customize the label font:
| Attribute Name | Description |
|---|---|
|
Sets the font family for the label text |
|
Sets the font size for the label text |
|
Sets the hex code for the label text color |
|
Set this attribute to |
|
Set this attribute to |
The data structure to render the above shown treemap chart is given below:
{
    "chart": {
        "plotborderfillcolor": "fff",
        "plotborderthickness": "0",
        "animation": "0",
        "labelGlow": "0",
        "horizontalPadding": "1",
        "verticalPadding": "1",
        "caption": "Harry's SuperMart: Product-wise Revenue",
        "subcaption": "Previous Year",
        "labelFont": "Times New Roman",
        "labelFontSize": "12",
        "labelFontColor": "#990099",
        "labelFontBold": "1",
        "labelFontItalic": "1"
    },
    "data": [
        {
            "label": "Harry's SuperMart",
            "value": "1000",
            "fontcolor": "fff",
            "fillcolor": "#303030",
            "data": [
                {
                    "label": "Food Products",
                    "value": "400",
                    "fontcolor": "fff",
                    "fillcolor": "#527a7a",
                    "data": [
                        {
                            "label": "Dairy",
                            "value": "80",
                            "fillcolor": "#99ffcc"
                        },
                        {
                            "label": "Cereals",
                            "value": "70",
                            "fillcolor": "#e5fff2"
                        },
                        {
                            "label": "Poultry",
                            "value": "150",
                            "fillcolor": "#00cc66"
                        },
                        {
                            "label": "Vegetables",
                            "value": "100",
                            "fillcolor": "#33ff99"
                        }
                    ]
                },
                {
                    "label": "Non-food Products",
                    "value": "600",
                    "fontcolor": "fff",
                    "fillcolor": "#404040",
                    "data": [
                        {
                            "label": "Apparel",
                            "value": "400",
                            "fontcolor": "fff",
                            "fillcolor": "#666",
                            "data": [
                                {
                                    "label": "Men's Wear",
                                    "value": "150",
                                    "fillcolor": "ff8080"
                                },
                                {
                                    "label": "Women's Wear",
                                    "value": "200",
                                    "fillcolor": "#ff6666"
                                },
                                {
                                    "label": "Children's Wear",
                                    "value": "50",
                                    "fillcolor": "#ffcccc"
                                }
                            ]
                        },
                        {
                            "label": "Kitchenware",
                            "value": "150",
                            "fillcolor": "#e6b3ff"
                        },
                        {
                            "label": "Electronics",
                            "value": "50",
                            "fillcolor": "#eeccff"
                        }
                    ]
                }
            ]
        }
    ]
}
Configuring the Glow Effect for Data Labels
The glow effect in treemap labels is the application for a surrounding background color to the text labels, in a color different from the labelFontColor.
A treemap chart with the glow effect configured for the data labels is shown below:
The glow effect is useful when the data label font color and the rectangle fill color is the same or similar, especially when the chart is rendered with a gradient legend.
Given below is a brief description of the attributes used to customize the glow effect for data labels:
| Attribute Name | Description |
|---|---|
|
Sets this attribute to |
|
Sets the intensity of the glow effect |
|
Sets the hex code for the glow effect color |
|
Sets the radius for applying the glow effect around the label |
The data structure to render the above chart is given below:
{
    "chart": {
        "plotborderfillcolor": "fff",
        "plotborderthickness": "0",
        "animation": "0",
        "labelGlow": "1",
        "horizontalPadding": "1",
        "verticalPadding": "1",
        "caption": "Harry's SuperMart: Product-wise Revenue",
        "subcaption": "Previous Year",
        "showLegend": "1",
        "baseFontBold": "1",
        "labelFontColor": "990099",
        "labelGlowIntensity": "50",
        "labelGlowColor": "#5c5c3d",
        "labelGlowRadius": "10"
    },
    "data": [
        {
            "label": "Harry's SuperMart",
            "value": "1000",
            "fontcolor": "fff",
            "fillcolor": "#303030",
            "data": [
                {
                    "label": "Food Products",
                    "value": "400",
                    "fontcolor": "fff",
                    "fillcolor": "#527a7a",
                    "data": [
                        {
                            "label": "Dairy",
                            "value": "80",
                            "fillcolor": "#99ffcc"
                        },
                        {
                            "label": "Cereals",
                            "value": "70",
                            "fillcolor": "#e5fff2"
                        },
                        {
                            "label": "Poultry",
                            "value": "150",
                            "fillcolor": "#00cc66"
                        },
                        {
                            "label": "Vegetables",
                            "value": "100",
                            "fillcolor": "#33ff99"
                        }
                    ]
                },
                {
                    "label": "Non-food Products",
                    "value": "600",
                    "fontcolor": "fff",
                    "fillcolor": "#404040",
                    "data": [
                        {
                            "label": "Apparel",
                            "value": "400",
                            "fontcolor": "fff",
                            "fillcolor": "#666",
                            "data": [
                                {
                                    "label": "Men's Wear",
                                    "value": "150",
                                    "fillcolor": "ff8080"
                                },
                                {
                                    "label": "Women's Wear",
                                    "value": "200",
                                    "fillcolor": "#ff6666"
                                },
                                {
                                    "label": "Children's Wear",
                                    "value": "50",
                                    "fillcolor": "#ffcccc"
                                }
                            ]
                        },
                        {
                            "label": "Kitchenware",
                            "value": "150",
                            "fillcolor": "#e6b3ff"
                        },
                        {
                            "label": "Electronics",
                            "value": "50",
                            "fillcolor": "#eeccff"
                        }
                    ]
                }
            ]
        }
    ]
}
Customizing the Data Plots in a Treemap Chart
Customizing the Data Plot Color
In a data-driven treemap chart, color ranges are used to define colors for data plots based on their values. For a treemap chart, data plot colors can be defined:
- manually, using the
fillColorattribute - automatically, depending on the data value, using the
colorRangeobject
Take a look at the treemap chart shown below:
Data plots in this treemap chart have been colored manually.
Given below is a brief description of the fillColor attribute:
| Attribute Name | Description |
|---|---|
|
Sets the hex code for the color to be used for the data plot. The |
The data structure to render the above chart is given below:
{
    "chart": {
        "plotborderfillcolor": "fff",
        "plotborderthickness": "0",
        "animation": "0",
        "labelGlow": "0",
        "horizontalPadding": "1",
        "verticalPadding": "1",
        "caption": "Harry's SuperMart: Product-wise Revenue",
        "subcaption": "Previous Year"
    },
    "data": [
        {
            "label": "Harry's SuperMart",
            "value": "1000",
            "fontcolor": "fff",
            "fillcolor": "#303030",
            "data": [
                {
                    "label": "Food Products",
                    "value": "400",
                    "fontcolor": "fff",
                    "fillcolor": "#527a7a",
                    "data": [
                        {
                            "label": "Dairy",
                            "value": "80",
                            "fillcolor": "#99ffcc"
                        },
                        {
                            "label": "Cereals",
                            "value": "70",
                            "fillcolor": "#e5fff2"
                        },
                        {
                            "label": "Poultry",
                            "value": "150",
                            "fillcolor": "#00cc66"
                        },
                        {
                            "label": "Vegetables",
                            "value": "100",
                            "fillcolor": "#33ff99"
                        }
                    ]
                },
                {
                    "label": "Non-food Products",
                    "value": "600",
                    "fontcolor": "fff",
                    "fillcolor": "#404040",
                    "data": [
                        {
                            "label": "Apparel",
                            "value": "400",
                            "fontcolor": "fff",
                            "fillcolor": "#666",
                            "data": [
                                {
                                    "label": "Men's Wear",
                                    "value": "150",
                                    "fillcolor": "ff8080"
                                },
                                {
                                    "label": "Women's Wear",
                                    "value": "200",
                                    "fillcolor": "#ff6666"
                                },
                                {
                                    "label": "Children's Wear",
                                    "value": "50",
                                    "fillcolor": "#ffcccc"
                                }
                            ]
                        },
                        {
                            "label": "Kitchenware",
                            "value": "150",
                            "fillcolor": "#e6b3ff"
                        },
                        {
                            "label": "Electronics",
                            "value": "50",
                            "fillcolor": "#eeccff"
                        }
                    ]
                }
            ]
        }
    ]
}
The treemap chart shown below is colored using the colorRange object:
The colorRange object defines the numeric ranges of the gradient legend.
The data structure to render this chart is given below:
{
    "chart": {
        "plotborderfillcolor": "fff",
        "plotborderthickness": "0",
        "animation": "0",
        "labelGlow": "0",
        "horizontalPadding": "1",
        "verticalPadding": "1",
        "caption": "Harry's SuperMart: Product-wise Revenue",
        "subcaption": "Previous Year"
    },
    "data": [
        {
            "label": "Harry's SuperMart",
            "value": "1000",
            "data": [
                {
                    "label": "Food Products",
                    "value": "400",
                    "data": [
                        {
                            "label": "Dairy",
                            "value": "70"
                        },
                        {
                            "label": "Cereals",
                            "value": "80"
                        },
                        {
                            "label": "Poultry",
                            "value": "150"
                        },
                        {
                            "label": "Vegetables",
                            "value": "100"
                        }
                    ]
                },
                {
                    "label": "Non-food Products",
                    "value": "600",
                    "data": [
                        {
                            "label": "Apparel",
                            "value": "400",
                            "data": [
                                {
                                    "label": "Men's Wear",
                                    "value": "150"
                                },
                                {
                                    "label": "Women's Wear",
                                    "value": "200"
                                },
                                {
                                    "label": "Children's Wear",
                                    "value": "50"
                                }
                            ]
                        },
                        {
                            "label": "Kitchenware",
                            "value": "150"
                        },
                        {
                            "label": "Electronics",
                            "value": "50"
                        }
                    ]
                }
            ]
        }
    ],
    "colorrange": {
        "mapbypercent": "0",
        "gradient": "1",
        "minvalue": "0",
        "startlabel": "Poor",
        "endlabel": "Good",
        "color": [
            {
                "code": "FF3300",
                "maxvalue": "100",
                "label": "BAD"
            },
            {
                "code": "33CC33",
                "maxvalue": "200",
                "label": "AVERAGE"
            }
        ]
    }
}
Customizing the Font Color for a Specific Data Plot
To customize the font color for a data plot, define the fontColor attribute, with a hex color code, for that particular data plot.
A treemap chart with the font color customized for Women’s Wear is shown below:
The data structure to render this chart is given below:
{
    "chart": {
        "plotborderfillcolor": "fff",
        "plotborderthickness": "0",
        "animation": "0",
        "labelGlow": "0",
        "horizontalPadding": "1",
        "verticalPadding": "1",
        "caption": "Harry's SuperMart: Product-wise Revenue",
        "subcaption": "Previous Year"
    },
    "data": [
        {
            "label": "Harry's SuperMart",
            "value": "1000",
            "fontcolor": "fff",
            "fillcolor": "#303030",
            "data": [
                {
                    "label": "Food Products",
                    "value": "400",
                    "fontcolor": "fff",
                    "fillcolor": "#527a7a",
                    "data": [
                        {
                            "label": "Dairy",
                            "value": "80",
                            "fillcolor": "#99ffcc"
                        },
                        {
                            "label": "Cereals",
                            "value": "70",
                            "fillcolor": "#e5fff2"
                        },
                        {
                            "label": "Poultry",
                            "value": "150",
                            "fillcolor": "#00cc66"
                        },
                        {
                            "label": "Vegetables",
                            "value": "100",
                            "fillcolor": "#33ff99"
                        }
                    ]
                },
                {
                    "label": "Non-food Products",
                    "value": "600",
                    "fontcolor": "fff",
                    "fillcolor": "#404040",
                    "data": [
                        {
                            "label": "Apparel",
                            "value": "400",
                            "fontcolor": "fff",
                            "fillcolor": "#666",
                            "data": [
                                {
                                    "label": "Men's Wear",
                                    "value": "150",
                                    "fillcolor": "ff8080"
                                },
                                {
                                    "label": "Women's Wear",
                                    "value": "200",
                                    "fillcolor": "#ff6666",
                                    "fontcolor": "#6600ff"
                                },
                                {
                                    "label": "Children's Wear",
                                    "value": "50",
                                    "fillcolor": "#ffcccc"
                                }
                            ]
                        },
                        {
                            "label": "Kitchenware",
                            "value": "150",
                            "fillcolor": "#e6b3ff"
                        },
                        {
                            "label": "Electronics",
                            "value": "50",
                            "fillcolor": "#eeccff"
                        }
                    ]
                }
            ]
        }
    ]
}
Only the font color can be customized for individual data plots. Other font customizations like the font family or the font size are not available at the individual data plot level.
Rendering the Legend in the Treemap Chart
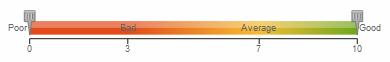
A treemap chart can be rendered with the gradient legend.
A gradient legend is a pane of blended colors derived from the colorRange definitions. A linear scale is drawn with two drag-able pointers. Each color defined for a numeric range blends with the next color, thus forming a gradient strip. Each point on the gradient scale represents a unique color and value. So, all different values in the chart will appear in unique colors as per their position on the gradient scale.
A simple gradient legend is looks as shown in the image below:
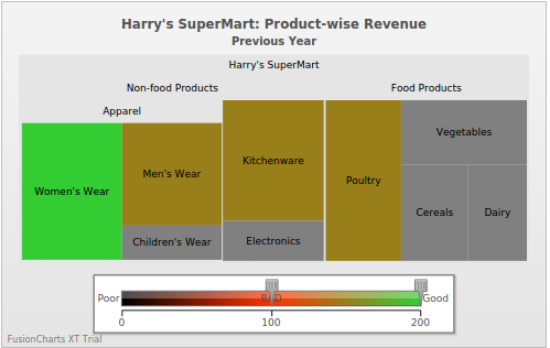
A treemap chart rendered with the gradient legend is shown below:
Given below is a brief description of the attributes used to render the treemap chart with a gradient legend:
| Attribute Name | Description |
|---|---|
|
Set this attribute to |
|
Set this attribute to |
|
Sets the label for the lower limit on the gradient legend scale. This attribute belongs to the |
|
Sets the label for the upper limit on the gradient legend scale. This attribute belongs to the |
The |
Child object of the |
|
Sets the hex color code for a color range on the gradient legend scale. This attribute belongs to the |
|
Sets the upper limit for a color range on the gradient legend scale. The limit is inclusive of the value assigned to this attribute. This attribute belongs to the |
|
Sets the label for a color range on the gradient legend scale. The label is rendered within the tooltip text for all nodes that fall under this color range. This attribute belongs to the |
The data structure to render the above chart is given below:
{
"chart": {
"plotborderfillcolor": "fff",
"plotborderthickness": "0",
"animation": "0",
"labelGlow": "0",
"horizontalPadding": "1",
"verticalPadding": "1",
"caption": "Harry's SuperMart: Product-wise Revenue",
"subcaption": "Previous Year"
},
"data": [
{
"label": "Harry's SuperMart",
"value": "1000",
"data": [
{
"label": "Food Products",
"value": "400",
"data": [
{
"label": "Dairy",
"value": "70"
},
{
"label": "Cereals",
"value": "80"
},
{
"label": "Poultry",
"value": "150"
},
{
"label": "Vegetables",
"value": "100"
}
]
},
{
"label": "Non-food Products",
"value": "600",
"data": [
{
"label": "Apparel",
"value": "400",
"data": [
{
"label": "Men's Wear",
"value": "150"
},
{
"label": "Women's Wear",
"value": "200"
},
{
"label": "Children's Wear",
"value": "50"
}
]
},
{
"label": "Kitchenware",
"value": "150"
},
{
"label": "Electronics",
"value": "50"
}
]
}
]
}
],
"colorrange": {
"mapbypercent": "0",
"gradient": "1",
"minvalue": "0",
"startlabel": "Poor",
"endlabel": "Good",
"color": [
{
"code": "FF3300",
"maxvalue": "100",
"label": "BAD"
},
{
"code": "33CC33",
"maxvalue": "200",
"label": "AVERAGE"
}
]
}
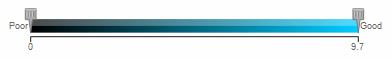
}Configuring a Single-color Gradient Legend
The default gradient legend is rendered using several different colors. However, you can also render a gradient legend using shades of the same color.
A single-color gradient legend looks as shown in the image below:
The code snippet needed to show a single-color gradient legend is given below:
{
    ...
    "colorRange": {
        "gradient": "1",
        "mapByPercent": "0",
        "minValue": "0",
        "code": "#00ccff",
        "startLabel": "Poor",
        "endLabel": "Good"
    }
}
Showing/Hiding Data Values Using the Gradient Legend
The gradient legend is interactive and allows filtering of nodes within a specific range of values. Drag any one or both the scale pointers to set the required lower and upper limit.
The sample treemap chart with the gradient legend set to show only those nodes that have values between 100 and 200 is shown in the image below. Notice that the nodes that don’t fall in this bracket have been grayed out.
Click here for the complete list of attributes supported by the treemap chart.