Demos

Beginner's Guide

Charts / Gauges / Maps Guide

Customizing Charts

API

Integrating With Your Stack

Help

Loading

A treemap chart is useful when hierarchical information has to be analyzed. A treemap chart is created using 2D nested rectangles, which can be compared to gain insights from hierarchical information.

A simple treemap chart is shown below:

FusionCharts will load here..

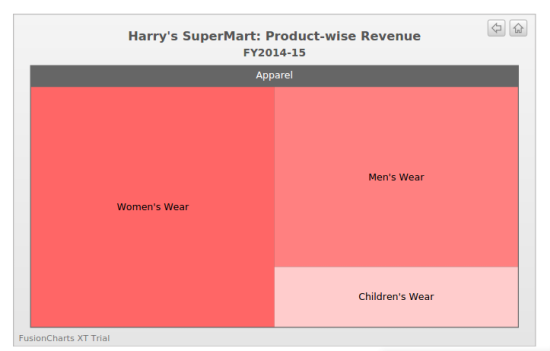
This treemap chart plots the revenue generated by Harry’s SuperMart, based on the type of products—food and non-food. The chart plots product-wise revenue information by breaking the products into two broad categories and further branching them into sub-categories, like a tree data structure.

When a rectangle is clicked, the clicked node and its subtree replaces the current root node. For example, in the above chart, when Women’s Wear is clicked, the chart view changes as shown in the image below:

image alt text

Click the rectangles in the treemap chart shown above and see how you can traverse through the leaf nodes.

The data structure needed to create this chart is given below:

{ "chart": { "plotborderfillcolor": "fff", "plotborderthickness": "0", "animation": "0", "labelGlow": "0", "horizontalPadding": "1", "verticalPadding": "1", "caption": "Harry's SuperMart: Product-wise Revenue", "subcaption": "Previous Year" }, "data": [ { "label": "Harry's SuperMart", "value": "1000", "fontcolor": "fff", "fillcolor": "#303030", "data": [ { "label": "Food Products", "value": "400", "fontcolor": "fff", "fillcolor": "#527a7a", "data": [ { "label": "Dairy", "value": "80", "fillcolor": "#99ffcc" }, { "label": "Cereals", "value": "70", "fillcolor": "#e5fff2" }, { "label": "Poultry", "value": "150", "fillcolor": "#00cc66" }, { "label": "Vegetables", "value": "100", "fillcolor": "#33ff99" } ] }, { "label": "Non-food Products", "value": "600", "fontcolor": "fff", "fillcolor": "#404040", "data": [ { "label": "Apparel", "value": "400", "fontcolor": "fff", "fillcolor": "#666", "data": [ { "label": "Men's Wear", "value": "150", "fillcolor": "ff8080" }, { "label": "Women's Wear", "value": "200", "fillcolor": "#ff6666" }, { "label": "Children's Wear", "value": "50", "fillcolor": "#ffcccc" } ] }, { "label": "Kitchenware", "value": "150", "fillcolor": "#e6b3ff" }, { "label": "Electronics", "value": "50", "fillcolor": "#eeccff" } ] } ] } ] }
{
    "chart": {
        "plotborderfillcolor": "fff",
        "plotborderthickness": "0",
        "animation": "0",
        "labelGlow": "0",
        "horizontalPadding": "1",
        "verticalPadding": "1",
        "caption": "Harry's SuperMart: Product-wise Revenue",
        "subcaption": "Previous Year"
    },
    "data": [
        {
            "label": "Harry's SuperMart",
            "value": "1000",
            "fontcolor": "fff",
            "fillcolor": "#303030",
            "data": [
                {
                    "label": "Food Products",
                    "value": "400",
                    "fontcolor": "fff",
                    "fillcolor": "#527a7a",
                    "data": [
                        {
                            "label": "Dairy",
                            "value": "80",
                            "fillcolor": "#99ffcc"
                        },
                        {
                            "label": "Cereals",
                            "value": "70",
                            "fillcolor": "#e5fff2"
                        },
                        {
                            "label": "Poultry",
                            "value": "150",
                            "fillcolor": "#00cc66"
                        },
                        {
                            "label": "Vegetables",
                            "value": "100",
                            "fillcolor": "#33ff99"
                        }
                    ]
                },
                {
                    "label": "Non-food Products",
                    "value": "600",
                    "fontcolor": "fff",
                    "fillcolor": "#404040",
                    "data": [
                        {
                            "label": "Apparel",
                            "value": "400",
                            "fontcolor": "fff",
                            "fillcolor": "#666",
                            "data": [
                                {
                                    "label": "Men's Wear",
                                    "value": "150",
                                    "fillcolor": "ff8080"
                                },
                                {
                                    "label": "Women's Wear",
                                    "value": "200",
                                    "fillcolor": "#ff6666"
                                },
                                {
                                    "label": "Children's Wear",
                                    "value": "50",
                                    "fillcolor": "#ffcccc"
                                }
                            ]
                        },
                        {
                            "label": "Kitchenware",
                            "value": "150",
                            "fillcolor": "#e6b3ff"
                        },
                        {
                            "label": "Electronics",
                            "value": "50",
                            "fillcolor": "#eeccff"
                        }
                    ]
                }
            ]
        }
    ]
}

Brief Explanation of the Data Structure

Given below is a brief explanation of the data structure shown above:

Attribute Name Description

type

Type of chart to render. To render a treemap chart, the value for this attribute will be treemap.

renderAt

Container object within which the chart will be rendered

width

Width of the chart, in pixels

height

Height of the chart, in pixels

dataFormat

Format in which data that will passed to the chart object. This attribute takes two four values:
json (JSON data to render the chart is passed to the dataSource attribute)
jsonurl (the relative path to a .json file is passed to the dataSource attribute)
Similarly, xml and xmlurl are also valid values.

dataSource

Source from where chart data will be fetched, depending on the value passed to the dataFormat attribute

caption

Chart caption
This attribute belongs to the chart object.

subCaption

Chart sub-caption
This attribute belongs to the chart object.

label

Label for a data item. The label is rendered within its corresponding rectangle.
This attribute belongs to the data object.

value

Value for a data item.
This attribute belongs to the data object.

fillcolor

Hex code for the color of a rectangle

Click here for the complete list of attributes supported by the treemap chart.

Top