Pyramid charts are used in comparison of data, e.g. sales data of a product for a year. A pyramid chart consists of various segments, each representing a dataset. The height of the pyramid segment with respect to the entire pyramid depicts the value for that particular dataset.
Each pyramid segment can have its individual properties like background, border etc. to help distinguish them from one another. Adjacent to the pyramid segments, the label and value of that pyramid can be displayed.
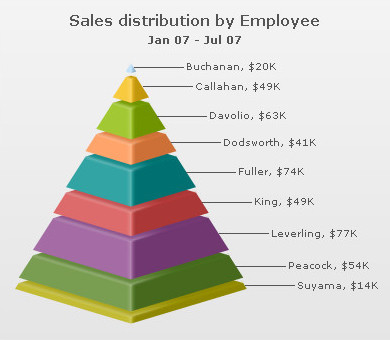
Shown below is a simple pyramid chart generated using FusionWidgets XT:
- Interactive pyramid slices, when clicked can separate from the main pyramid.
- Ability to seamlessly convert 3D pyramid to 2D pyramid, by right clicking on chart and selecting View 2D
- Option to render the pyramid in 2D mode itself with more control over border and fill properties
- Option to show values as actual values or in percentage
- Smart labels to avoid overlapping of pyramid labels
- Option to place labels at side or at center
- Custom tool text for each pyramid slice
- Links supported for each pyramid slice