Legend
The legend is a chart element that allows you to display the series name for each dataset in a chart. A chart should have one legend at the most. Each legend can have a lot of legend items. Each legend item has a key and a name. In FusionTime, currently the key is a rectangular box filled with the color of the series (or plot) it represents; and the name is the name of the series (or plot).
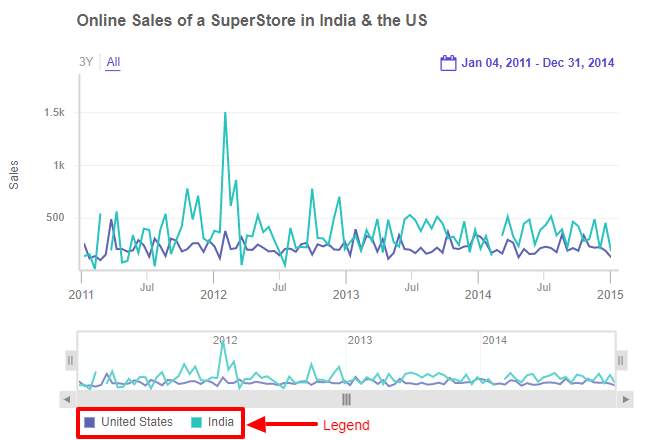
The legend comes in very handy when we have multiple colored plots. It helps in easily identifying the plot. Legends are interactive by nature. You can click on a legend item to disable the plot associated with it.
In the screenshot below, you can see the legend rendered below the time series. You can see each dataset represented by an icon.
Legend Items cannot be showed in stock charts.
Show/Hide the Legend
To show/hide the legend, set the value of the enabled attribute under the legend object to 1.
Refer to the code below:
legend: {
enabled: '1',
item: [{
value: 'Series A' // name of visible legend item
}, {
value: 'Series B'
}]
}Initially Hidden Legend item
To keep the legend item hidden when the chart is initially rendered, set the value of the initiallyhidden attribute to 1 within the item object under the legend object.
Refer to the code below:
legend: {
enabled: '1',
item: [{
value: 'Series A' // name of visible legend item
initiallyhidden: 1, // boolean attribute (default 0) to control the visibility of plot
}, {
value: 'Series B'
initiallyhidden: 0,
}]
}Configure Legend position
By default the legend box is placed below the chart, you can use the position and alignment attributes in the legend object to set the legend position and alignment.
- Specify the position of the legend using the
positionattribute, you can set its value to one of the following:bottom,top,left, andright. This attribute places the legend in one of four positions around the chart. For example, in the following code sample the legend is placed at the top of the chart.
legend: {
enabled: '1',
position: 'top'
}- Specify the alignment of the legend using the
alignmentattribute, you can set its value to one of the following:start,middle, andend. This attribute aligns the legend relative to the chart body and legend position, for example in the following code sample the legend is placed at the top-left of the chart.
legend: {
enabled: '1',
position: 'top',
alignment: 'end'
}