Data Markers
You can use a Data Marker in a chart to indicate an important event, which occurred on a specific data point. You can hover the mouse pointer over a data marker or tap on it to show additional description of the event in the tooltip.
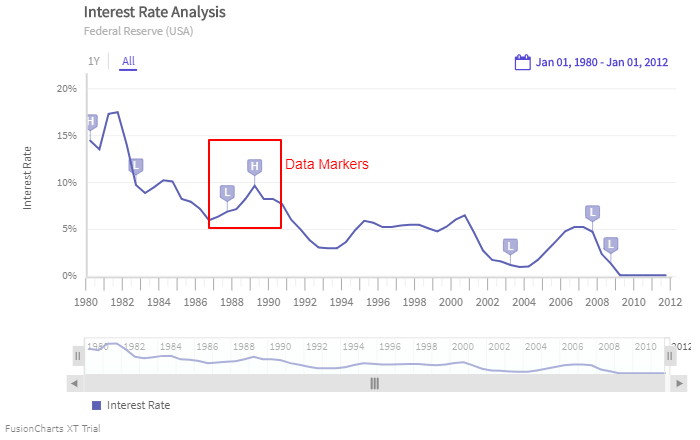
A data marker looks as shown in the image below:
Create a Data Marker
To create a data marker, use the AddMarker() instance of DataMarkerObject to create a data marker. AddMarker() accepts a string type parameter. Use this parameter to mention the name of the data series that will display the marker.
Configure Data Marker
Once you create a data marker, use the following instance methods of AddMarker() to configure the data marker:
Use the
Identifier()method, which accepts a character parameter, to set the character you want to display within the marker.Use the
Time()method, which accepts a string parameter, to set the time of the data point where you want to display the marker.Use the
Tooltext()method, which accepts a string parameter, to set the tooltext of the data marker.Use the
Type()method, which accepts aTimeSeries.DataMarker.MarkerTypeenum with a value ofFLAGorPIN, to indicate how you want to display the data marker on the plot.Use the
TimeFormat()method, which accepts a string parameter, to set the time format for the data marker.
Refer to the code below:
/* AddMarker returns an instance of DataMarkerObject */
/* Identifier(), Time(),ToolText(),Type(),TimeFormat() are instance method of AddMarker and can be invoked as : */
timeSeries.DataMarker.AddMarker("series name").Identifier('.').Time("Oct-1987").ToolText("The FED is forced to ease rate after the stock market crash").Type(TimeSeries.DataMarker.MarkerType.FLAG).TimeFormat("%b-%Y");The chart will look as shown below: