Crossline
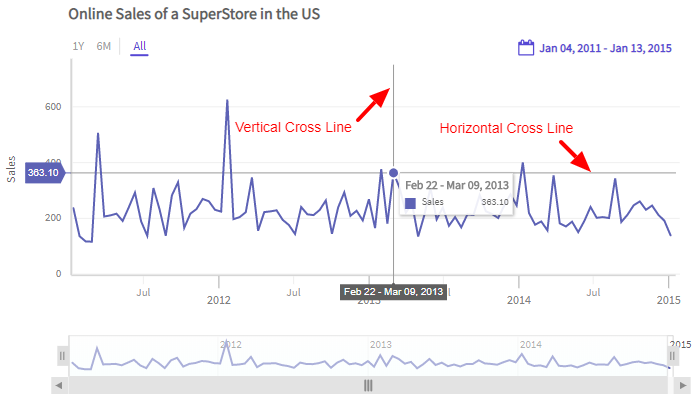
Crosslines are vertical/horizontal lines which appear on the chart when you interact with it. They give you quick context of the data.
Vertical crossline appears on the time axis when you hover on the canvas. It gives you context about the time.
Horizontal crossline appears on the y-axis when you hover on the data plot. It gives you context about the data value.
Refer to the image below:
In the case of multivariate charts, the vertical crosslines will be visible in each canvas for a particular time instance, whereas the horizontal crossline will appear only on the canvas on which the user is interacting.

Configure Crossline
Use the CrossLine object of the timeSeries instance of the TimeSeriesChart class to define a Crossline. You can also add style to the crossline of a time-series chart as shown in the code below:
timeSeries.CrossLine.Style.LineStyle.FillColor = "#aecdef";
timeSeries.CrossLine.Style.LabelStyle.StrokeColor = "#aecdef";
timeSeries.CrossLine.Style.LineStyle.StrokeLineCap = PlotStyleConfigurationObject.LineCap.SQUARE;
timeSeries.CrossLine.Style.LineStyle.StrokeWidth = 2;