Starting FusionMaps XT, you can use popular jQuery syntax to render and manipulate FusionMaps XT. This can be done using FusionCharts jQuery plugin.
FusionMaps XT uses the FusionCharts jQuery plugin that takes care of all the products of FusionCharts Suite XT, including FusionMaps XT.
FusionCharts jQuery plugin helps you to render FusionMaps XT anywhere within a Web page. Also it helps you to change the map type, update and retrieve map data, update functional and cosmetic settings and use all existing features of FusionCharts. Adding a map at the end or beginning of an existing container is easily possible using this plugin. Moreover, a custom selector helps you find all the maps in your page or in any container element.
In the following sections of this page, we will see how to set-up and use this plugin.
Setting up of FusionCharts jQuery plugin is very easy. You will need to follow these simple steps:
- Copy all or only the required map SWF files (from the Download Pack > Maps folder) to your preferred folder
- Copy FusionCharts.js and jquery.min.js and FusionCharts.jqueryplugin.js from the Download Pack > Maps folder to the preferred folder
- Copy FusionCharts.HC.js and FusionCharts.HC.Maps.js from the Download Pack > Maps folder to the preferred folder to create JavaScript maps.
- Add references to the required JavaScript files in your code as shown below:
<script type="text/javascript" src="Maps/jquery.min.js"></script>
<script type="text/javascript" src="Maps/FusionCharts.js"></script>
<script type="text/javascript" src="Maps/FusionCharts.jqueryplugin.js"></script>
This completes the setup.
Please note that you do not need to explicitly include FusionCharts.HC.js and FusionCharts.HC.Maps.js in your code. FusionCharts.js will automatically load these files as and when required.
Let us now create our first map using FusionCharts jQuery plugin.
We will start with the same population data which we have created in Creating your first map page as shown below:
<map borderColor='005879' fillColor='D7F4FF' numberSuffix='M' includeValueInLabels='1' labelSepChar=':' baseFontSize='9'>
     <data>
        <entity id='NA' value='515' />
        <entity id='SA' value='373'/>
        <entity id='AS' value='3875' />
        <entity id='EU' value='727' />
        <entity id='AF' value='885' />
        <entity id='AU' value='32' />
     </data>
</map> |
|
We had already saved this data as Data.xml.
The code to use this data and generate a world map using FusionCharts jQuery plugin is as follows:
<html>
  <head>
    <title>My First map using FusionMaps</title>
    <script type="text/javascript" src="Maps/jquery.min.js"></script>
    <script type="text/javascript" src="Maps/FusionCharts.js"></script>
    <script type="text/javascript" src="Maps/FusionCharts.jqueryplugin.js"></script>
  </head>
  <body>
    <div id="mapContainer">FusionMaps XT will load here!</div>
    <script type="text/javascript"><!--

      $(document).ready(function(){
          $("#mapContainer").insertFusionCharts({
               swfUrl: "Maps/FCMap_World.swf",
               dataSource: "Data.xml",
               dataFormat: "xmlurl",
               width: "400",
               height: "300",
               id: "myMapId"
         });

       });

    // -->
    </script>
  </body>
</html>
We save the above code as FirstMap.html. In the above code we have:
- Selected the element (DIV) with id mapContainer
- Called the insertFusionCharts method (available from the plugin)
- Passed all required map configurations like swfUrl, width, height, dataSource, dataFormat, id etc. to the method as JavaScript object
The insertFusionCharts method renders a map within the selected element. It takes a set of key or value pairs representing map configurations as parameter. The set is passed as an Object. The properties of the parameter-object are as follows:
| Map configuration or property | Description and acceptable value |
| swfUrl or type | Provide path (as string) to the map SWF file through swfUrl or provide the map alias through type property. You can get the list of map SWF file names and map alias from List of Maps page.
JavaScript map are rendered when type property is used. |
| id | Sets the DOM Id of the map. The value is provided as string. (optional) |
| width | Width of the map (optional - default is 400). The value is provided as number if the width is in pixels or as string and if width is to be set in percentage (for example, "50%") |
| height | Height of the map (optional - default is 300). The value is provided as number if the height is set in pixels or as string and if the height is to be set in percentage (for example, "50%") |
| dataSource | XML or JSON map data. It can be a URL for XML or JSON. It can also be a string containing XML or JSON object |
| dataFormat | Defines the format of the dataSource.
|
| renderer | Sets the map renderer engine. Acceptable values are 'flash' and 'javascript'. The default value is automatically selected depending on the availability and support of Flash player. When set to javascript FusionCharts JavaScript Class renders pure JavaScript maps. (optional) |
| wmode | Allows the map's base background to become transparent or opaque. The acceptable values and their usage are as follows:
Note: Map's base background is the first background layer on which map messages are shown and all map objects are rendered. While rendering, another background layer is drawn on top of this base background whose cosmetic properties can be customized through XML/JSON. This property is optional and the default value is opaque. |
| bgColor | This sets the color of the map's base background on which a map is drawn. The color is passed as a string containing hex coded color value.
This property is optional and the default value is "#FFFFFF", that is, white. Note: Map's base background color is not same as the background color of a map (set through XML/JSON). The base background color is visible while showing map messages or when wmode is set to opaque and map's bgAlpha is set to less than 100. |
| scaleMode | Flash player's mode of scaling a map. NoScale is the default value. There are other settings namely, showAll, ExactFit, noBorder. But these are not supported and might result in distorted maps. (optional) |
| lang | Sets the language for map messages. It presently supports only English. The value is "EN". (optional) |
| detectFlashVersion | Set to "1" to make FusionCharts Class check whether Flash Player 8 is present in the Browser. (optional - Default value is "0" ) |
| autoInstallRedirect | Set to "1" with detectFlashVersion set to "1" and FusionCharts redirects to Flash Player installation page of Adobe's Web site. (optional - default is "0") |
| debugMode | Sets the map debug window on. Can take "0" or "1". When set to "1", the map shows a debug window over itself. (optional - default value is "0") |
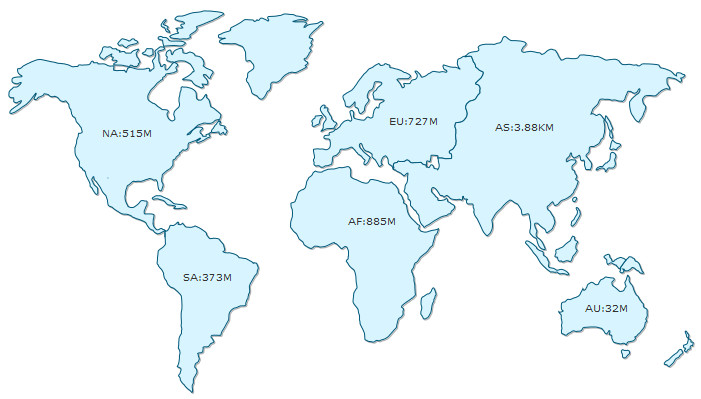
The resultant map will be rendered as shown in the image below:
What happens if Flash player is not available?
In case Flash Player is not available on certain devices (like iPad or iPhone), FusionCharts JavaScript library automatically renders the same map using JavaScript. If you are running the sample from local file system, please note that you will need to provide the data using the Data String method, that is, passing the data (XML/JSON) to the map as String or JSON Object. Due to security implementation of many browsers which blocks AJAX in local file systems, and since the JavaScript maps use AJAX, the Data URL method (loading data from external XML/JSON file) will not work.
You can also render JavaScript map using the same method. All you will need to do is to explicitly set the renderer property to javascript. In case you are running the sample from local file system, you will also need to set the map data as string. The code snippet below contains the modified sample:
$("#mapContainer").insertFusionCharts({
               swfUrl: "Maps/FCMap_World.swf",
               renderer: "JavaScript",
               width: "400",
               height: "300",
               id: "myMapId",

               dataFormat: "xml",
               dataSource: "<map borderColor='005879' fillColor='D7F4FF' numberSuffix='M' includeValueInLabels='1' labelSepChar=':' baseFontSize='9'>" +
     "<data>" +
     "<entity id='NA' value='515' />" +
     "<entity id='SA' value='373'/>" +
     "<entity id='AS' value='3875' />" +
     "<entity id='EU' value='727' />" +
     "<entity id='AF' value='885' />" +
     "<entity id='AU' value='32' />" +
     "</data>" +
"</map>"
         });
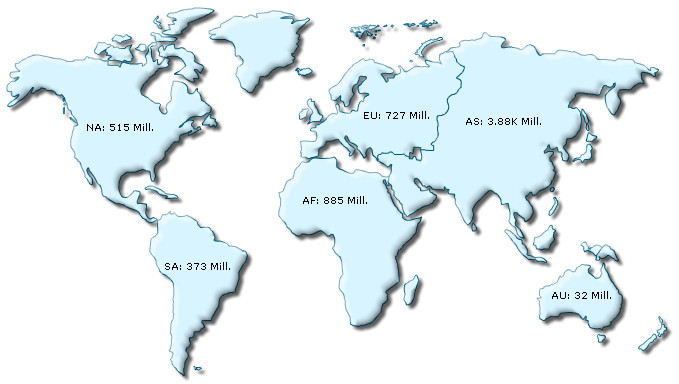
The resultant map will look like the image shown below:
Apart from XML you can also provide data in JSON format. You can provide JSON as JavaScript Object, as JSON string or as a URL. To provide data as JSON you will need to pass the JSON data source to dataSource property and set json or jsonurl to dataFormat property.
The code snippet below shows how you can pass JSON Object as data source:
$("#mapContainer").insertFusionCharts({
	swfUrl: "Maps/FCMap_World.swf",
	width: "400",
	height: "300",
	id: "myMapId",

	dataFormat: "json",
	dataSource:{
  "map": {
    "bordercolor": "005879",
    "fillcolor": "D7F4FF",
    "numbersuffix": "M",
    "includevalueinlabels": "1",
    "labelsepchar": ":",
    "basefontsize": "9"
  },
  "data": [
    { "id": "NA", "value": "515" },
    { "id": "SA", "value": "373" },
    { "id": "AS", "value": "3875" },
    { "id": "EU", "value": "727" },
    { "id": "AF","value": "885" },
    { "id": "AU", "value": "32" }
  ]
});
The code snippet below shows how you can pass JSON string as data source:
$("#mapContainer").insertFusionCharts({
	swfUrl: "Maps/FCMap_World.swf",
	width: "400",
	height: "300",
	id: "myMapId",

	dataFormat: "json",
	dataSource: '{ ' +
 ' "map": { ' +
  ' "bordercolor": "005879", ' +
  ' "fillcolor": "D7F4FF", ' +
  ' "numbersuffix": "M", ' +
  ' "includevalueinlabels": "1", ' +
  ' "labelsepchar": ":", ' +
  ' "basefontsize": "9" ' +
' }, ' +
' "data": [ ' +
 ' { "id": "NA", "value": "515" }, ' +
 ' { "id": "SA", "value": "373" }, ' +
 ' { "id": "AS", "value": "3875" }, ' +
 ' { "id": "EU", "value": "727" }, ' +
 ' { "id": "AF","value": "885" }, ' +
 ' { "id": "AU", "value": "32" } ' +
' ] ' +
' } ' +
' } ' );
The code snippet below shows how you can pass a URL containing JSON as data source:
$("#mapContainer").insertFusionCharts({
	swfUrl: "Maps/FCMap_World.swf",
	width: "400",
	height: "300",
	id: "myMapId",

	dataFormat: "jsonurl",
	dataSource: "data.json"
});
Here is a quick reference map of FusionCharts jQuery API. Click on the desired item to know more.
| Name | What it does? |
| insertFusionCharts() method | Renders maps inside containers |
| appendFusionCharts() method | Adds maps at the end of containers |
| prependFusionCharts() method | Adds maps at the beginning of containers |
| cloneFusionCharts() method | Clones maps |
| updateFusionCharts() method | Updates map settings like type, width, height, data, renderer etc. |
| attrFusionCharts() method | Gets a map attribute or sets one of multiple map attributes |
| :FusionCharts selector | Finds all FusionCharts Objects (charts, maps and gauges) within a page or an element |
| bind() method | Binds an event listener with FusionCharts specific events |
In the following pages we will learn how to use FusionCharts jQuery plugin to: