| Using various map rendering methods in FusionCharts jQuery plugin | ||||||||||||||||||||||||||||||
|
FusionMaps XT uses FusionCharts jQuery plugin that takes care of all the products of FusionCharts Suite XT including FusionMaps XT. FusionCharts jQuery plugin provides you various methods using which you can render maps in HTML containers. There are three methods to choose from as listed below:
To aid your understanding of this section, we will recommend you to go through the Overview page of FusionCharts jQuery plugin In this page we will learn in details, how to use these methods. |
||||||||||||||||||||||||||||||
| Using insertFusionCharts method | ||||||||||||||||||||||||||||||
|
In the previous page we have learned how to use the insertFusionCharts() method to render map. The insertFusionCharts method is the basic method which renders maps inside HTML elements. The HTML elements need to be selected using jQuery selector. In case, multiple HTML elements are selected using the jQuery selector, a map will be rendered inside each selected HTML element. All existing elements inside the selected elements will be replaced by the rendered maps. An example can be as follows: <html>
<head>
<title>My First map using FusionMaps XT</title>
<script type="text/javascript" src="Maps/FusionCharts.js"></script>
<script type="text/javascript" src="Maps/jquery.min.js"></script>
<script type="text/javascript" src="Maps/FusionCharts.jqueryplugin.js"></script>
</head>
<body>
<div id="mapContainer">FusionMaps XT will load here!</div>
<script type="text/javascript"><!--
$(document).ready(function(){
$("#mapContainer").insertFusionCharts({
swfUrl: "Maps/FCMap_World.swf",
dataSource: "Data.xml",
dataFormat: "xmlurl",
width: "400",
height: "300",
id: "myMapId"
});
});
// -->
</script>
</body>
</html>
As stated in the above code, the insertFusionCharts method takes a set of key (map setting) or value pairs containing configuration properties of the rendered map. The detailed list of acceptable map-configurations are provided in the Overview page and also stated below:
The insertFusionCharts method returns a jQuery array containing the selected HTML elements where the maps render. Click here to read API Reference guide of insertFusionCharts() method. |
||||||||||||||||||||||||||||||
| Using JSON as data source | ||||||||||||||||||||||||||||||
|
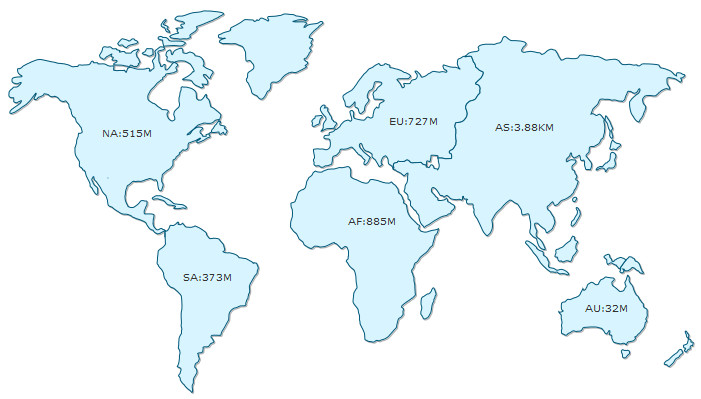
Apart from XML you can also provide data in JSON format. You can provide JSON as JavaScript Object, as JSON string or as a URL. To provide data as JSON you will need to pass the JSON data source to dataSource property and set json or jsonurl to dataFormat property. The code snippet below shows how you can pass JSON Object as data source: $("#mapContainer").insertFusionCharts({
swfUrl: "Maps/FCMap_World.swf",
width: "400",
height: "300",
id: "myMapId",
dataFormat: "json",
dataSource: {
"map": {
"bordercolor": "005879",
"fillcolor": "D7F4FF",
"numbersuffix": "M",
"includevalueinlabels": "1",
"labelsepchar": ":",
"basefontsize": "9"
},
"data": [
{ "id": "NA", "value": "515" },
{ "id": "SA", "value": "373" },
{ "id": "AS", "value": "3875" },
{ "id": "EU", "value": "727" },
{ "id": "AF","value": "885" },
{ "id": "AU", "value": "32" }
]
});
The code snippet below shows how you can pass JSON string as data source: $("#mapContainer").insertFusionCharts({
swfUrl: "Maps/FCMap_World.swf",
width: "400",
height: "300",
id: "myMapId",
dataFormat: "json",
dataSource:'{ ' +
' "map": { ' +
' "bordercolor": "005879", ' +
' "fillcolor": "D7F4FF", ' +
' "numbersuffix": "M", ' +
' "includevalueinlabels": "1", ' +
' "labelsepchar": ":", ' +
' "basefontsize": "9" ' +
' }, ' +
' "data": [ ' +
' { "id": "NA", "value": "515" }, ' +
' { "id": "SA", "value": "373" }, ' +
' { "id": "AS", "value": "3875" }, ' +
' { "id": "EU", "value": "727" }, ' +
' { "id": "AF","value": "885" }, ' +
' { "id": "AU", "value": "32" } ' +
' ] ' +
'}'});
The code snippet below shows how you can pass a URL containing JSON as data source: $("#mapContainer").insertFusionCharts({
swfUrl: "Maps/FCMap_World.swf",
width: "400",
height: "300",
id: "myMapId",
dataFormat: "jsonurl",
dataSource: "data.json"
});
Many web servers like IIS6, do not serve .json (no wildcard MIME type) files by default. You need to setup your web server to serve json files. In IIS6 you can do this using these steps:
NOTE: Many browsers restrict JavaScript from accessing local file system owing to security reasons. The JavaScript maps, when running locally, will not be able to access JSON data provided as a URL. If you run the files from a server, it will run absolutely fine, though. When running locally, however, if you provide the data as JavaScript Object or JSON String, it works fine. |
||||||||||||||||||||||||||||||
| Inserting map at the end of HTML elements | ||||||||||||||||||||||||||||||
|
Using appendFusionCharts method, you can render and insert maps at the end of selected HTML elements, thus preserving all existing elements inside the selected elements. An example code sample is shown below: $("#mapContainer").appendFusionCharts({
swfUrl: "Maps/FCMap_World.swf",
dataSource: "March.xml",
dataFormat: "xmlurl",
width: "400",
height: "300",
id: "myMapMarID"
});
The parameters accepted by appendFusionCharts method is same as that of the insertFusionCharts method. The detailed list of acceptable map-configurations are provided in the Map configurations table above. The appendFusionCharts method returns a jQuery array containing the selected HTML elements where the maps render. Click here to read API Reference guide of appendFusionCharts() method |
||||||||||||||||||||||||||||||
| Inserting map at the beginning of HTML elements | ||||||||||||||||||||||||||||||
|
You can also render and insert maps at the beginning of selected HTML elements. This also preserves all the elements already present in the selected elements. You will need to use the prependFusionCharts method to achieve this. An example code snippet is shown below: $("#mapContainer").prependFusionCharts({
swfUrl: "Maps/FCMap_World.swf",
dataSource: "January.xml",
dataFormat: "xmlurl",
width: "400",
height: "300",
id: "myMapJanID"
});
The parameters accepted by the prependFusionCharts method is same as that of the insertFusionCharts method. The detailed list of acceptable map-configurations are provided in the Map configurations table above. The prependFusionCharts method returns a jQuery array containing the selected HTML elements where the maps render. Click here to read API Reference guide of prependFusionCharts() method |
||||||||||||||||||||||||||||||
| Cloning a map | ||||||||||||||||||||||||||||||
|
You can clone existing maps and pass the list of cloned maps to a function for further processing. To clone maps, you will need to use cloneFusionCharts method. This method looks for all the maps in jQuery selected elements and clones them. The example below clones all the maps present in a div with ID - "leftPanel" and renders them as JavaScript maps in a div with ID - "rightPanel": $("#leftPanel").cloneFusionCharts( function() { $("#rightPanel").insertFusionCharts(this[0]); }, { renderer: "javascript" } );
In the above code cloneFusionCharts finds all the maps in HTML elements with id - "leftPanel". It clones the maps present in that HTML element and passes the array containing the cloned maps to the anonymous callback function defined as the first parameter. This function generates these cloned maps inside HTML elements having "rightPanel" as id. The second parameter also adds a new configuration (setting renderer to 'javascript' ) to the cloned maps. Hence, the cloned maps will be rendered using JavaScript rendering engine. Additional Notes: Parameters: The first parameter contains the reference to a callback function. An array of cloned maps (in this Array) is passed to a callback function for further processing. In the second parameter, you can optionally add various configurations to the cloned maps or over-write some configurations of the cloned maps. The configurations are passed as a set of key/value pairs (JavaScript object). The configurations which can be passed are given in the list below:
Click here to read API Reference guide of cloneFusionCharts() method |
||||||||||||||||||||||||||||||
| FusionCharts jQuery plugin also supports creating maps within elements that have not yet been added to the HTML document object. Such maps will not be visible until the newly created elements are added to the document object. |