FusionCharts for Flex > Quick Chart Configuration > Zero Plane
Zero plane is a plane, which separates the positive and negative numbers on a chart having both of them.
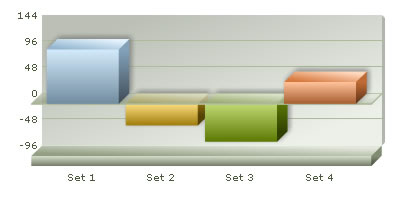
The zero plane appears in the column, line, and the area chart. It can be removed in the line chart but not in the column or the area chart because they use this as their base to draw. It can be removed in the line chart by setting showZeroPlane='0'. Vertical zero plane in the scatter and bubble charts can be removed by setting showVZeroPlane='0'.
Customizing the zero plane
The customizable attributes for the zero plane in a 2D chart are:
| Attribute Name | Range | Description |
|---|---|---|
| zeroPlaneColor | Color for the Zero Plane | |
| zeroPlaneThickness | In Pixels | Thickness of zero plane |
| zeroPlaneAlpha | 0-100 | Alpha of zero plane |
<chart zeroPlaneColor='000000' zeroPlaneThickness='1' zeroPlaneAlpha='80'....>
The attributes for the zero plane of a 3D chart are:
| Attribute Name | Range | Description |
|---|---|---|
| zeroPlaneColor | Color for the Zero Plane | |
| zeroPlaneAlpha | 0-100 | Alpha of zero plane |
| zeroPlaneShowBorder | Boolean | Whether to show border of zero plane |
| zeroPlaneBorderColor | Color | Sets the border color of zero plane |
<chartzeroPlaneColor='FFFFFF' zeroPlaneAlpha='80' zeroPlaneBorderColor='999999'....>
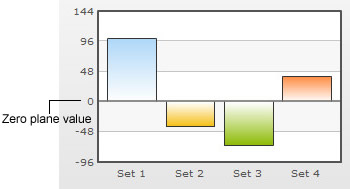
Show or hide zero plane value
You can also opt to show or hide the value on which the zero plane exists on the y-axis. To do so you need to set the attribute showZeroPlaneValue='0' in the <chart> element. A chart with and without zero plane value is displayed below:
 |
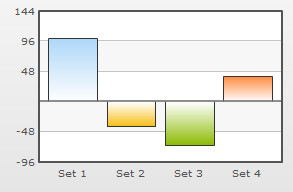 |
Chart displaying zero plane value |
Chart not displaying zero plane value
|
Note: In Dual Y-Axis charts showPZeroPlaneValue='0' hides the zero plane value for the Primary Y-Axis and showSZeroPlaneValue='0' hides the zero plane value for the Secondary Y-Axis.
Vertical zero plane in scatter and bubble charts
In scatter and bubble charts, you can configure vertical zero planes. The attributes used to configure the vertical zero plane are as follows:
| Attribute Name | Range | Description |
|
showVZeroPlane
Since v1.3 |
0/1 | Whether to show vertical zero plane. Zero Plane is the line/plane that appears at 0 x-position on canvas, when negative data is being shown on the chart. |
|
vZeroPlaneColor
Since v1.3 |
Hex Code without # | Color of the vertical zero plane |
|
vZeroPlaneThickness
Since v1.3 |
In Pixels | Thickness of the vertical zero plane |
|
vZeroPlaneAlpha
Since v1.3 |
0-100 | Transparency of the vertical zero plane |
Applying effects to the zero plane
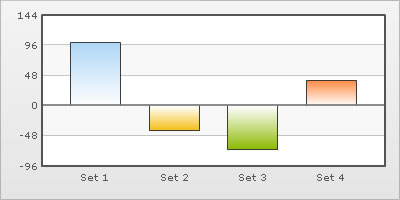
We can apply effects (shadow, glow, blur, and bevel) to the div lines and zero plane using STYLES. To apply any style to the zero plane, we need to apply the style to the divisional lines. Shown below is the chart that comprises of shadow for the div lines.
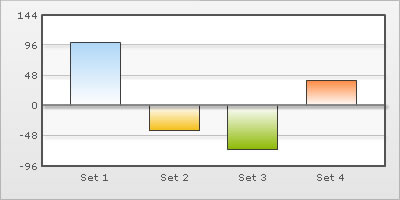
The XML for the above chart is as follows:
<chart showValues='0' >
    <set name='Set 1' value='100' />
    <set name='Set 2' value='-40' />
    <set name='Set 3' value='-70' />
    <set name='Set 4' value='40' />

    <styles>
        <definition>
            <style name='myShadow' type='shadow' angle='45' distance='3' color='000000'/>
        </definition>
        <application>
            <apply toObject='DIVLINES' styles='myShadow' />
        </application>
    </styles>
    </chart>
Similarly, the other effects can be applied to the div lines & zero plane.
Animating div lines & zero plane
You can also apply animation effects to the div lines and zero plane. The following XML would cause the x-Scale of the div lines and zero plane to animate.
<chart showValues='0' >
    <set name='Set 1' value='100' />
    <set name='Set 2' value='-40' />
    <set name='Set 3' value='-70' />
    <set name='Set 4' value='40' />

    <styles>
        <definition>
            <style name='myAnim1' type='animation' param='_xScale' start='0' duration='1'/>
        </definition>
        <application>
            <apply toObject='DIVLINES' styles='myAnim1' />
        </application>
    </styles>

</chart>