FusionCharts for Flex > Your First Chart > Simple Sales Chart
The previous page rendered a chart with some dummy data. But, let's now use our own data - real-life data, say, sales data. In this section we will create a simple sales chart in Flex using FusionCharts for Flex. The instructions provided in this section can be implemented with Flash Builder (previously known as Flex Builder) and Flex SDK.
Note: Install FusionCharts for Flex before proceeding with this section. For information regarding installation see the installation types section.
Simple Sales Chart XML
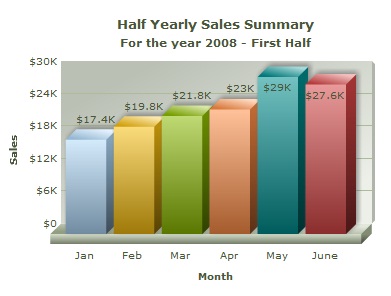
For this example we'll be plotting half yearly sales summary for a given year, say 2008. The data to be used is displayed in the table (below). We will create a Column 3D chart for presenting the data.
| Month | Sales(2008) |
|---|---|
| January | $17400 |
| February | $19800 |
| March | $21800 |
| April | $23000 |
| May | $29000 |
| June | $27600 |
FusionCharts for Flex internally takes in data only in custom XML format. So, we need to convert the data into XML.
To know more about FusionCharts XML, please go through the FusionCharts and XML > Chart XML Reference section.
The converted XML data is shown below:
<chart caption='Half Yearly Sales Summary' subcaption='For the year 2008 - First Half'
   xAxisName='Month' yAxisName='Sales' numberPrefix='$'>
	<set label='Jan' value='17400' />
	<set label='Feb' value='19800' />
	<set label='Mar' value='21800' />
	<set label='Apr' value='23000' />
	<set label='May' value='29000' />
	<set label='June' value='27600' />
</chart>
Punch the above code (you can even copy paste the XML code) into a text editor (e.g., Notepad) and save it as Data.xml inside the src folder.
Please don't worry about whatever spaghetti stuff we have just written - we'll soon cover them. Basically, what we've done can be listed in following points:
- We've created the root <chart> element with a few attributes that define the captions, axis names, and the number prefix character.
- Each row of the table has been incorporated in a <set> element. The label attribute represents the month name and value attribute represents the numeric data value that is to be plotted.
In order to verify whether the XML document is structurally valid, open the file in your browser. If the XML is correct, you'll see the XML data displayed in a formatted way.
And now, if you're running out of patience to build the chart, let's quickly get started.
Note: FusionCharts for Flex allows you to provide chart data using XMLString, Array, XMLList, or Model. So, instead of manually writing the XML, you can provide data using any of these methods and FusionCharts for Flex will automatically convert it to XML. These methods of providing data will be discussed in the coming sections.
Building the Chart
First, complete the basic setup, as discussed in the installation section. After creating a new project in Flex Builder open the Source view, you'll find that the following code has been automatically generated.
<?xml version="1.0" encoding="utf-8"?>
<s:Application xmlns:fx="http://ns.adobe.com/mxml/2009"
			   xmlns:s="library://ns.adobe.com/flex/spark"
			   xmlns:mx="library://ns.adobe.com/flex/mx">


</s:Application>
Next, switch to the Design view. Here, you will find a custom component named FusionCharts in the Components panel. Now, follow these steps to create a chart.
- Drag the FusionCharts custom component and drop it onto the stage. You will find that a control with FusionCharts logo has been created on the stage.
- Next, switch to the
Propertiespanel. Select theCategory Viewoption and choose the FusionCharts group.
- Select 'Column3D' as the value of FCChartType from the drop-down list. Here, Column 3D is the chart type which we intend to use.
- Set Data.xml as the value of FCDataURL. FCDataURL property sets the path of the XML file that contains chart data.
- Please note that unlike the first chart that we created in the previous page, we would NOT set FCUseDefaultData property. Because, now we do not need dumy data. We would supply our own data.
Now, run the project to render the chart and see the result of your hard work.
If you switch to the Source view, you'll find the following auto generated code.
<?xml version="1.0" encoding="utf-8"?>
<s:Application xmlns:fx="http://ns.adobe.com/mxml/2009"
			   xmlns:s="library://ns.adobe.com/flex/spark"
			   xmlns:mx="library://ns.adobe.com/flex/mx" xmlns:components="com.fusioncharts.components.*">

	<components:FusionCharts x="10" y="10" FCChartType="Column3D" FCDataURL="Data.xml"/>


</s:Application>
The highlighted sections of the code (above) are the attributes that have been set automatically. If you are code savvy, you can always avoid the Design view's drag-drop mechanism and build the chart by directly writing the code in in the Source view.
Use script to create a chart
The code below shows how to use script to create the above chart:
<?xml version="1.0" encoding="utf-8"?>
<s:Application xmlns:fx="http://ns.adobe.com/mxml/2009"
			   xmlns:s="library://ns.adobe.com/flex/spark"
			   xmlns:mx="library://ns.adobe.com/flex/mx"

			   initialize="application1_initializeHandler(event)"

			   >
	<fx:Script>
		<![CDATA[
			import com.events.FCEvent;
			import com.fusioncharts.components.*;
			import mx.events.FlexEvent;

			public var myChart:FusionCharts;

			protected function application1_initializeHandler(event:FlexEvent):void
			{
				myChart = new FusionCharts();
				myChart.FCChartType = "Column2D";
				myChart.FCDataURL ="Data.xml";
				myChart.x = 10;
				myChart.y = 10;
				myChart.width = 400;
				myChart.height = 300;

				addElement(myChart);

			}

		]]>
	</fx:Script>
	<fx:Declarations>
		<!-- Place non-visual elements (e.g., services, value objects) here -->
	</fx:Declarations>
</s:Application>