Driving from Database >> Script and Render Map
- We will create a script BuildDataFMQS to get sales data from the edit boxes in the layout.
- We will create a script BuildColorRangeFMQS to set color for 3 grades of sales - High, Moderate and Low.
- We will have another script InitializeMap that will configure other map configurations and finally plot the data on map.
Go to Portal Row [ First ]
Loop
Set Variable [ $InternalID; Value:FusionMaps_USSales::StateId ]
Set Variable [ $Value; Value:FusionMaps_USSales::Amount ]
Set Variable [ $FMQSData; Value:$FMQSData & "[" & $InternalID & "=" & $Value & "]" ]
Go to Portal Row [ Next; Exit after last ]
End Loop
Go to Portal Row [ First ]
Exit Script [ Result: $FMQSData ]
- In the first line we initialize a variable - $FMQSData to store all sales data in FMQS format.
- Next we move to the first portal record.
- Now we loop through each portal record.
- In FMQS data format we extract the map's Internal Ids from portal field - StateId in variable - $InternalID .
- We extract corresponding sales amount from portal field - Amount in variable - $Value .
- We accumulate these data in $FMQSData variable.
Set Variable [ $InternalID; Value:FusionMaps_USSales::StateId ]
Set Variable [ $Value; Value:FusionMaps_USSales::Amount ]
Set Variable [ $FMQSData; Value:$FMQSData & "[" & $InternalID & "=" & $Value & "]" ]
- Finally the script returns the data part of FMQS.
- We create this script to set the grade colors for each state.
- Each grade has a range value. That means each grade has 2 properties minValue and maxValue.
- Moreover, each has a color and displayValue to specify.
- Thus we create 3 grades or color ranges - High, Moderate and Low.
Set Variable [ $FMQSColorRange; Value:$FMQSColorRange & "[minValue=1000000;maxvalue=10000000;color=e3b65c;
displayValue=Moderate Sales]" ]
Set Variable [ $FMQSColorRange; Value:$FMQSColorRange & "[minValue=10000000;maxValue=1000000000;color=dc9300;
displayValue=High Sales]" ]
Exit Script [ Result: $FMQSColorRange ]
- First, we define 'Low Sales' grade that will set a pale color to all states whose sales figures fall between 0 and 100000.
- Then we define 'Moderate Sales' grade that will set a darker color to all states whose sales figures fall between 1000000 and 10000000.
- Finally, we give 'High Sales' grade that will set a darker color to all states whose sales figures fall between 10000000 and 1000000000 .
Freeze Window
Perform Script [ “InitializeFusionMaps” from file: “FusionMapsLibrary” ]
Perform Script [ “AppendMapParameterToFMURL” from file: “FusionMapsLibrary”; Parameter: "USA¶600¶400" ]
Set Variable [ $FMFMURL; Value:Get ( ScriptResult ) ]
Perform Script [ “AppendMapParamsParameterToURL” from file: “FusionMapsLibrary”; Parameter: $FMFMURL & "¶" &
"canvasBorderColor=e7cd7d;bgColor=e7c47d;numberPrefix=$;decimals=2;formatNumberScale=1;showBevel=1;
showShadow=1;toolTipBgColor=fff8d1;toolTipBorderColor=ba9853;baseFont=Verdana;baseFontSize=11;
baseFontColor=563207" ]
Set Variable [ $FMFMURL; Value:Get ( ScriptResult ) ]
Perform Script [ “BuildColorRangeFMQS” ]
Set Variable [ $ColorRange; Value:Get ( ScriptResult ) ]
Perform Script [ “AppendColorRangeParameterToURL” from file: “FusionMapsLibrary”; Parameter: $FMFMURL & "¶" & $ColorRange ]
Set Variable [ $FMFMURL; Value:Get ( ScriptResult ) ]
Perform Script [ “BuildDataFMQS” ]
Set Variable [ $FMQSData; Value:Get ( ScriptResult ) ]
Perform Script [ “AppendDataToURL” from file: “FusionMapsLibrary”; Parameter: $FMFMURL&"¶"& $FMQSData ]
Set Variable [ $FMFMURL; Value:Get ( ScriptResult ) ]
Set Variable [ $FMQSStyleDef; Value:"[name=PlotShadow;type=shadow;color=c09c5a;alpha=40][name=PlotBevel;type=bevel;distance=3]" ]
Perform Script [ “AppendStyleDefParameterToURL” from file: “FusionMapsLibrary”; Parameter: $FMFMURL & "¶" & $FMQSStyleDef ]
Set Variable [ $FMFMURL; Value:Get ( ScriptResult ) ]
Set Variable [ $FMQSStyleApp; Value:"[toObject=plot;styles=PlotShadow,PlotBevel]" ]
Perform Script [ “AppendStyleAppParameterToURL” from file: “FusionMapsLibrary”; Parameter: $FMFMURL & "¶" & $FMQSStyleApp ]
Set Variable [ $FMFMURL; Value:Get ( ScriptResult ) ]
Set Web Viewer [ Object Name: "WVO_FUSIONMAPS"; URL: $FMFMURL ]
Refresh Window []
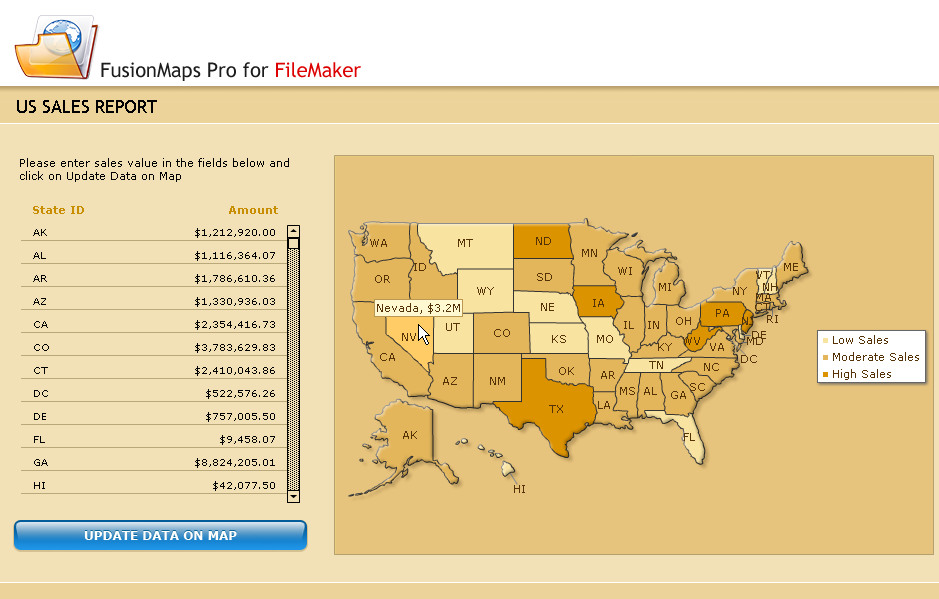
- The US Sales Report Layout is loaded first.
- From FusionMaps Library we run InitializeFusionMaps script. This script sets the current path of the FusionMaps Pro for FileMaker engine (which is 'Maps' folder under the working folder). It also sets the FusionMaps Pro for FileMaker engine file - FusionMaps.html to accept FMQS.
- Next, we run AddMapParametersToFMURL from library. Here we specify the map name, map width and height as parameters to the script. The script accepts and sets the necessary configurations.
- We store the FMQS in a variable - $FMFMURL.
- In the next line we define the map parameters in a calculation box and pass it to AppendMapParamsParameterToURL library script. This script sets the cosmetic, numerical and functional properties of the map. We use the following properties for the map: We will elaborately discuss these properties in section: Querystring format.
- Next, we call the BuildColorRangeFMQS script. It returns back the color range FMQS. We accumulate the data in $FMFMURL.
- Now we call the BuildDataFMQS script. It returns back the data in FMQS format. We again accumulate the data in $FMFMURL.
- We add bevel and shadow style to the map using AppendStyleDefParameterToURL and AppendStyleAppParameterToURL library script.
- Now, since the FMQS is fully built we set this to the Web-Viewer object - WVO_FUSIONMAPS.
- Finally, we refresh the window to show the map with newly plotted data.
Refresh Window []
- Hence, we create a button on the layout - UPDATE DATA ON MAP. We set this button, which when clicked, to run InitializeMap script. This script creates the FusionMaps URL and sets it to the Web Viewer object. The map is rendered almost instantly. So, after modifying data, we need to click on this button to show changes on the map.
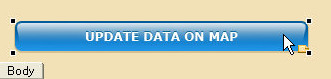
In the above screenshot we create a button named - 'UPDATE DATA ON MAP'.
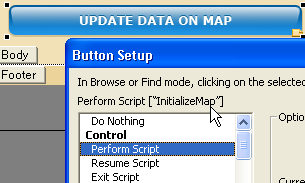
In the screenshot below we assign InitializeMap script to be performed when the button is clicked.
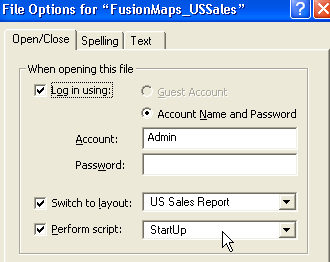
- The 'StartUp' script actually runs the 'InitializeMap' script and thus we see a map showing existing data whenever the file is opened. The 'StartUp' script has the following lines of codes:
#
Allow Toolbars [ Off ]
Show/Hide Status Area [ Hide ]
Show/Hide Text Ruler [ Hide ]
Adjust Window [ Maximize ]
Set Zoom Level [ Lock; 100% ]
#
# Configure and Load Map
Perform Script [ “InitializeMap” ]