|
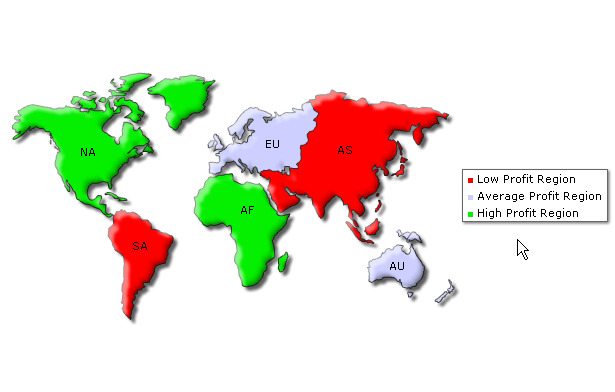
| Color Range helps us distinguish map entities by pre-defined colors based on their data value. Consider the screenshot below: |
| |
 |
| |
| The map above shows the business data of a company. As a Color Range has been defined, it becomes easy to point out Low, Average and High Profit making regions. The Querystring used to generate this map is given below: |
| |
?map=[mapName=World;mapWidth=620;mapHeight=400]
&colorRange=[1000;1999;ff0000;Low Profit Region][2000;2999;cccfff;Average Profit Region]
[3000;3999;05f000;High Profit Region]
&data=[NA=3910][SA=1375][EU=2248][AU=2568][AS=1890][AF=3288] |
| |
| The colorRange attribute helps us define different data ranges and assign specific color and caption to the segments. It uses four parameters. |
| |
| minValue - The lower data limit of the range. (1000, 2000 and 3000 in the above example) |
| maxValue - The upper data limit of the range. (1999, 2999 and 3999 in the above example) |
| color - A color for the range. It accepts Hexa Decimal Color Code without #. |
| displayValue - The name of the color range; it is displayed as Legend. (Low Profit Region, Average Profit Region and High Profit Region in the above example) |
| |
| We can define any number of color range. The parameters for each range should be enclosed by '[' and ']', separated by semicolon (;). The syntax of colorRange attribute is given below: |
| |
colorRange=[minValue;maxValue;color;displayValue][minValue;maxValue;color;displayValue]
........[minValue;maxValue;color;displayValue] |
| |
| |
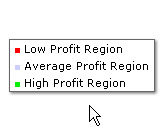
| Legend shows the Name with corresponding Color for each Color Range defined by us. See the image below: |
| |
 |
| |
| We can change the Cosmetic Properties of Legend. We will learn how to change Legend Properties in the next section. |
| |
| |