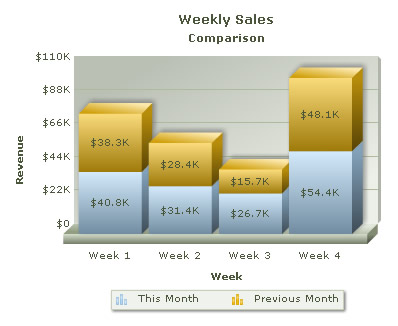
FusionCharts XT offers Stacked Chart – a type of multi-series chart where multiple datasets are stacked one above the other. Have a look at the image below to have an idea how a Stacked Chart looks like:
Before you go further with this page, we recommend you to please see the previous pages Creating First Chart and Creating Multi-series chart as we start off from concepts explained in that page.
The process of generating Stacked chart is same as multi-series chart. The only difference is here we need to specify a different chart type. Open and modify the multi-series chart you have created in the previous page like this:
<%@LANGUAGE="VBSCRIPT"%>
 <%
    'Include FusionCharts ASP Class
 %>
<!--#include file="../Class/FusionCharts_Gen.asp"-->
<%
dim FC
    'Create FusionCharts ASP class object
set FC = new FusionCharts
    'Set chart type to Stacked Column2D chart
Call FC.setChartType("StackedColumn3D")
...
As you can see, while creating the chart object, we have only changed the chart type to stackedColumn3D
FC = new FusionCharts
Call FC.setChartType("StackedColumn3D")
This is the trick. You can see that, instead of a multiseries chart, we render a stacked chart.
Please go through FusionCharts ASP Class API Reference section to know more about the functions used in the above code.
Here comes the output: