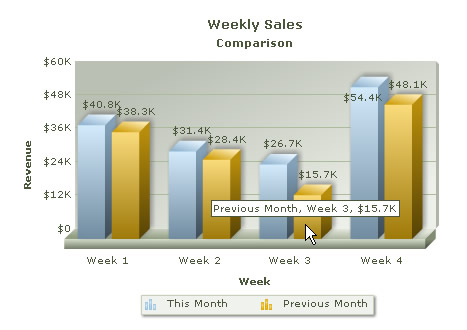
To plot multiple datasets we use multi-series charts. Consider the Weekly Sales chart for two consecutive months. Here, for each week, we have two sets of data coming from current month and previous month.
| Week | Current Month |
Previous Month |
Sales |
Sales |
|
| Week 1 | $40800 |
$38300 |
| Week 2 | $31400 |
$28400 |
| Week 3 | $26700 |
$15700 |
| Week 4 | $54400 |
$48100 |
Let's go through the following code that builds the multi-series chart shown above:
<%@LANGUAGE="VBSCRIPT"%>
 <%
    ' Include FusionCharts ASP Class
 %>
<!--#include file="../Class/FusionCharts_Gen.asp"-->
<%
dim FC
   ' Create FusionCharts ASP class object
set FC = new FusionCharts
   ' Set chart type to Multiseries Column3D chart
Call FC.setChartType("MSColumn3D")
   ' Set chart size
Call FC.setSize("450","350")
   ' Set the relative path of the SWF file
call FC.setSWFPath("../FusionCharts/")
      dim strParam
           ' Define chart attributes
           strParam="caption=Weekly Sales;subcaption=Comparison;xAxisName=Week;yAxisName=Revenue;numberPrefix=$"
           ' Set chart attributes
           call FC.setChartParams(strParam)
           ' Add category names
           call FC.addCategory("Week 1", "", "")
           call FC.addCategory("Week 2", "", "")
           call FC.addCategory("Week 3", "", "")
           call FC.addCategory("Week 4", "", "")
          ' Create a new dataset
           call FC.addDataset("This Month", "")
          ' Add chart values for the above dataset
           call FC.addChartData("40800", "", "")
           call FC.addChartData("31400", "", "")
           call FC.addChartData("26700", "", "")
           call FC.addChartData("54400", "", "")
          ' Create second dataset
           call FC.addDataset("Previous Month", "")
          ' Add chart values for the second dataset
           call FC.addChartData("38300", "", "")
           call FC.addChartData("28400", "", "")
           call FC.addChartData("15700", "", "")
           call FC.addChartData("48100", "", "")
 %>
     <html>
       <head>
         <title>Multi-series Chart : Using FusionCharts ASP Class</title>
         <script language='javascript' src='../FusionCharts/FusionCharts.js'></script>
       </head>
       <body>
             <%
               'Render Chart with JS embedding Method
                call FC.renderChart(false)
             %>
       </body>
     </html>
As you can see in the above code, we are doing the following:
- We include FusionCharts_Gen.asp.
- We create an object for Multi-series Column3D chart and set relative file path to the SWF file.
 set FC = new FusionCharts
 Call FC.setChartType("MSColumn3D")
 Call FC.setChartSize("450","350")
 Call FC.setSWFPath("../FusionCharts/")
- We store chart attributes in strParam variable and pass it to the setChartParams()function. It sets chart attributes.
- For multi-series charts, we need to add the category names separately using the addCategory()function.
Call FC.addCategory("Week 1","","")
Call FC.addCategory("Week 2","","")
Call FC.addCategory("Week 3","","")
Call FC.addCategory("Week 4","","")
- Now, we need to define the first dataset. Hence, we call addDataset()function. We set the dataset name as 'This Month'.
Call FC.addDataset("This Month") - We provide chart data specific to the above dataset. Remember to provide chart data just after the dataset is defined. Unlike single series charts (as we saw in the First Chart example), we need not specify other chart parameters here.
Call FC.addChartData("40800","","")
Call FC.addChartData("31400","","")
Call FC.addChartData("26700","","")
Call FC.addChartData("54400","","")
Please note that as we have 4 categories, we have entered 4 values for the dataset 'This Month'. - Next, we create the second dataset for 'Previous Month' and provide its data values.
Call FC.addDataset("Previous Month")
Call FC.addChartData("38300","","")
Call FC.addChartData("28400","","")
Call FC.addChartData("15700","","")
Call FC.addChartData("48100","","")
- We add FusionCharts.js.
- Finally, we render the chart.
Call FC.renderChart(false)
And the multi-series chart is ready!