To begin with, let's create a simple chart that will visually depict the Weekly Sales of a fictitious shop. The sample data we intend to plot can be tabularized as shown below:
| Week | Previous Month (sales) |
| Week 1 | $40800 |
| Week 2 | $31400 |
| Week 3 | $26700 |
| Week 4 | $54400 |
Let's see how to use FusionCharts ASP Class to plot this data into a column3D chart:
<%@LANGUAGE="VBSCRIPT"%>
 <%
   ' Include FusionCharts ASP Class
 %>
 <!--#include file="../Class/FusionCharts_Gen.asp"-->
 <%
dim FC
    ' Create FusionCharts ASP class object
set FC = new FusionCharts
    ' Set chart type to Column3D
Call FC.setChartType("Column3D")
    ' Set chart size
Call FC.setSize("300","250")
    ' Set the relative path of the SWF file
Call FC.setSWFPath("../FusionCharts/")
     dim strParam
            ' Define chart attributes
           strParam="caption=Weekly Sales;xAxisName=Week;yAxisName=Revenue;numberPrefix=$"
            ' Set chart attributes
         Call FC.setChartParams(strParam)
            ' Add chart values and category names
         Call FC.addChartData("40800","label=Week 1","")
         Call FC.addChartData("31400","label=Week 2","")
         Call FC.addChartData("26700","label=Week 3","")
         Call FC.addChartData("54400","label=Week 4","")
  %>
    <html>
      <head>
         <title>First Chart Using FusionCharts ASP Class</title>
         <script language='javascript' src='../FusionCharts/FusionCharts.js'></script>
      </head>
      <body>
           <%
               ' Render Chart with JS embedding Method
               Call FC.renderChart(false)
           %>
      </body>
    </html>
Let's analyze the steps involved in the above code:
- We include FusionCharts_Gen.asp in the program. This file contains FusionCharts ASP Class codes.
<!--#include file="../Class/FusionCharts_Gen.asp"-->
- We create a chart object.
set FC = new FusionCharts
- We specify the chart type.
Call FC.setChartType("Column3D")
- We specify the size of the chart.
Call FC.setSize("300","250")
- Next, we set a relative path to the chart SWF files using the setSwfPath() function. This is the path from which we load the chart SWF files.
Call FC.setSWFPath("../FusionCharts/")
- We store all desired chart attributes in the strParam variable and set chart attributes using the setChartParams() function.
strParam="caption=Weekly Sales;xAxisName=Week;yAxisName=Revenue;numberPrefix=$"
Call FC.setChartParams(strParam);
- Now, we provide chart data through the addChartData() function.We pass the value first and then the category name against each value as a parameter i.e., label=Week 1 etc.
Call FC.addChartData("40800","label=Week 1","")
Call FC.addChartData("31400","label=Week 2","")
Call FC.addChartData("26700","label=Week 3","")
Call FC.addChartData("54400","label=Week 4","")
NOTE: ASP does not support the concept of optional parameter. Hence, we need to provide all the parameters. In case you have nothing to pass as a parameter to a function, you need to provide a blank ("") value, as we did here for addChartData(). In the coming pages we will follow this rule as well.
- Finally, we include FusionCharts.js - FusionCharts JavaScript Embedding Class.
- And display the chart using the renderChart() function. Please note False is passed as a parameter to the renderChart() function. This is done to render the chart using JavaScript embedding method. IF you wish to render the chart using HTML embedding method, you will need to pass True instead.
Call FC.renderChart(false)
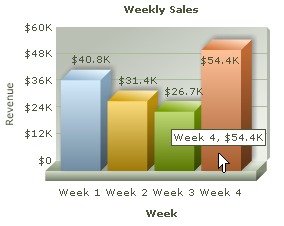
Here is the Column 3D chart that our FusionCharts ASP Class renders:
Please go through FusionCharts ASP Class API Reference section to know more about the functions used in the above code.
When we declare an object of FusionCharts ASP Class, we use initializing functions like setChartType, setSize etc.
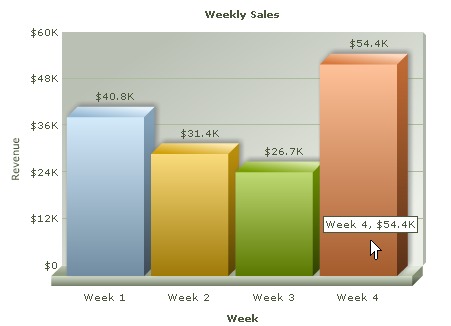
In the code above, the statement Call FC.setSize("300","250") sets the chart's width to 300 pixels and height to 250 pixels.
Hence, we can use this to set the desired dimension of our charts. Let's set our chart's dimension to 450 x 350 pixels.
Call FC.setSize("450","350")
As we discussed above, the chart type is also specified using setChartType function, while declaring FusionCharts ASP Class object.
Call FC.setChartType("Column3D")
To make a Pie Chart for our Weekly Revenue data, we just need to provide Pie3D instead of Column3D to setChartType function.
Call FC.setChartType("Pie3D") 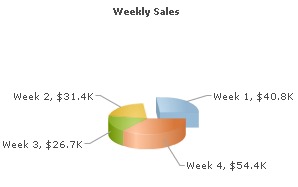
To change chart type you can use any of the Chart Type names listed below:
| Chart Type Name | Description |
| Column2D | Single Series Column 2D Chart |
| Column3D | Single Series Column 3D Chart |
| Line2D | Single Series Line 2D Chart |
| Pie3D | Single Series Pie 3D Chart |
| Pie2D | Single Series Pie 2D Chart |
| Bar2D | Single Series Bar 2D Chart |
| Area2D | Single Series Area 2D Chart |
| Doughnut2D | Single Series Doughnut 2D Chart |
| Doughnut3D | Single Series Doughnut 3D Chart |
| Pareto2D | Pareto 2D Chart |
| Pareto3D | Pareto 3D Chart |
| MSColumn3D | Multi-Series Column 3D Chart |
| MSColumn2D | Multi-Series Column 2D Chart |
| MSArea2D | Multi-Series Area 2D Chart |
| MSLine2D | Multi-Series Line 2D Chart |
| ZoomLine | Zoom Line chart |
| MSBar2D | Multi-Series Bar 2D Chart |
| MSBar3D | Multi-Series Bar 3D Chart |
| StackedColumn2D | Stacked Column 2D Chart |
| StackedColumn3D | Stacked Column 3D Chart |
| StackedBar2D | Stacked Bar 2D Chart |
| StackedBar3D | Stacked Bar 3D Chart |
| StackedArea2D | Stacked Area 2D Chart |
| MSStackedColumn2D | Multi-Series Stacked Column 2D Chart |
| Bubble | Multi-Series Bubble Chart |
| Scatter | Multi-Series Scatter Chart |
| ScrollColumn2D | Multi-Series Column 2D Scroll Chart |
| ScrollLine2D | Multi-Series Line 2D Scroll Chart |
| ScrollArea2D | Multi-Series Area 2D Scroll Chart |
| ScrollStackedColumn2D | Stacked Column 2D Scroll Chart |
| MSCombi3D | Multi-Series Combination Single Y-Axis 3D Chart |
| MSCombi2D | Multi-Series Combination Single Y-Axis 2D Chart |
| MSColumn3DLine | Multi-Series Combination Single Y-Axis Chart (Column 3D + Line) |
| MSCombiDY2D | Multi-Series Combination Dual Y-axis 2D Chart |
| MSColumn3DLineDY | Multi-Series Combination Dual Y-Axis Chart (Column 3D + Line) |
| StackedColumn2DLine | Stacked Combination Column 2D Line Single Y-Axis Chart |
| StackedColumn3DLine | Stacked Combination Column 3D Line Single Y-Axis Chart |
| StackedColumn3DLineDY | Stacked Combination Column 3D Line Dual Y-Axis Chart |
| ScrollCombi2D | Combination 2D Single Y-Axis Scroll Chart |
| ScrollCombiDY2D | Combination Dual Y-Axis 2D Scroll Chart |
| MSStackedColumn2DLineDY | Combination Multi-Series Stacked Column 2D-Line Dual Y-Axis Chart |
| Marimekko | Marimekko |
| Grid | Single Series Grid Chart |
Please note that Chart Type Names - Line, MSLine and MSColumnLine3D from previous version are changed to Line2D, MSLine2D and MSColumn3DLine (respectively). The old Names are still applicable, though deprecated. We recommend you to use the new Names.