In the previous example, we have seen sales comparison of two products using Multi-Series and Stacked charts. You might want to plot the data of individual products using different chart types on the same canvas. For example, the sales for Product A as Column chart and the sales for Product B as Area chart . In this example, we will see how to combine these two different charts into one canvas and represent the data. For this we will use a Combination chart. We will use the same Sales comparison data for two products. The chart will look as under:
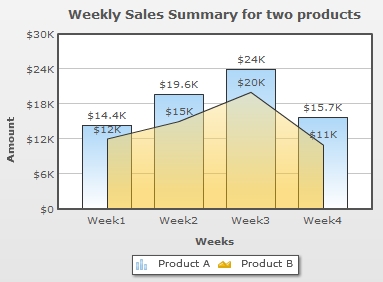
The data for the above chart is as under: (saved as CombiData.xml)
<chart caption='Weekly Sales Summary for two Products' xAxisName='Weeks' yAxisName='Amount' numberPrefix='$'>

	<categories>
	   <category Label="Week1"/>
	   <category Label="Week2"/>
	   <category Label="Week3"/>
	   <category Label="Week4"/>
	</categories>

	<dataset seriesName="Product A">
		<set  value='14400' />
		<set  value='19600' />
		<set  value='24000' />
		<set  value='15700' />
	</dataset>
	<dataset seriesName="Product B" renderAs='Area'>
		<set  value='12000' />
		<set  value='15000' />
		<set  value='20000' />
		<set  value='11000' />
	</dataset>

</chart>
<html>
  <head>
    <title>My First chart using FusionCharts XT</title>
    <script type="text/javascript" src="FusionCharts/FusionCharts.js">
    </script>
  </head>
  <body>
    <div id="chartContainer">FusionCharts XT will load here!</div>
    <script type="text/javascript"><!--

      var myChart = new FusionCharts( "FusionCharts/MSCombi2D.swf ",
      "myChartId", "400", "300", "0" );
      myChart.setXMLUrl("CombiData.xml");
      myChart.render("chartContainer");

    // -->
    </script>
  </body>
</html>
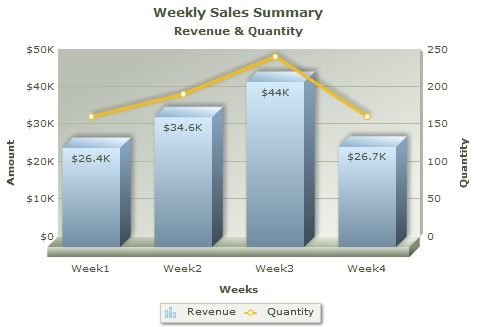
Now, we want to show a combination of weekly sales comparison along with total quantity of products sold in four weeks. The number of products sold will be represented by a line chart. The line chart will be plotted on the secondary axis with a different unit appearing on the right side of the chart. Here, we will need to use a Dual Y Axis chart. The chart will look as under:
Follow the steps below to create a combination chart:
- Create a folder LearningFusionCharts on your hard-drive. We will use this folder as the root folder for building all FusionCharts XT examples.
- Create a folder named MyFirstChart inside the above folder. Inside the MyFirstChart folder, create a folder named FusionCharts.
- Copy MSColumn3DLineDY.swf from Download Pack > Charts folder to the FusionCharts folder
- Copy FusionCharts.js, FusionCharts.HC.js, FusionCharts.HC.Charts.js, and jquery.min.js files from Download Pack > Charts folder to the FusionCharts folder
- Create an XML file in MyFirstChart folder with name CombiDYData.xml. The data used to show the comparison of Weekly revenue and total quantity for four weeks is given below in the table:
Week Revenue Quantity Week 1 $26,400 160 Week 2 $34,600 190 Week 3 $44,000 20 Week 4 $26,700 160
- Create the code given below, which is the XML-lized form of the sales data shown in the table (above). Copy the XML code to CombiDYData.xml file.
<chart caption='Weekly Sales Summary for two Products' xAxisName='Weeks' yAxisName='Amount' numberPrefix='$'>

	<categories>
	   <category Label="Week1"/>
	   <category Label="Week2"/>
	   <category Label="Week3"/>
	   <category Label="Week4"/>
	</categories>

	<dataset seriesName="Revenue">
		<set  value='26400' />
		<set  value='35600' />
		<set  value='44000' />
		<set  value='26700' />
	</dataset>
	<dataset seriesName='Total Quantity' ParentYAxis='s' showValues='0'>
		<set  value='160' />
		<set  value='190' />
		<set  value='220' />
		<set  value='160' />
	</dataset>

</chart>
In the above data, we have added a dataset with "Quantity" as seriesName. Also, we set this dataset to render on the Secondary y-axis using the parentYAxis attribute. The parentYAxis attribute allows you to set the parent axis of the dataset. The required value can be either P (primary axis) or S (secondary axis). By default, primary datasets are drawn against the left y-axis and the secondary against the right-axis. You can, however, chose to reverse that as well. For more details on this XML structure, please go through FusionCharts XT Data Format > XML > Combination Chart page.Note that you can also provide chart data in JSON format. View an example of JSON data here. Or, to learn more about FusionCharts XT JSON data format, please go through FusionCharts XT data formats > JSON section.
- Create an HTML file combi-weekly-sales-quantity.html in the same folder and copy-paste the code given below:
<html>
  <head>
    <title>My First chart using FusionCharts XT</title>
    <script type="text/javascript" src="FusionCharts/FusionCharts.js">
    </script>
  </head>
  <body>
    <div id="chartContainer">FusionCharts XT will load here!</div>
    <script type="text/javascript"><!--

      var myChart = new FusionCharts( "FusionCharts/MSColumn3DLineDY.swf",
      "myChartId", "400", "300", "0" );
      myChart.setXMLUrl("CombiDYData.xml");
      myChart.render("chartContainer");

    // -->
    </script>
  </body>
</html>
Open the file combi-weekly-sales-quantity.html in a Web browser and you will see an animated Combination chart similar to the one below:
See it live!
Code examples discussed in this section are present in Download Package > Code > MyFirstChart folder.
What happens if Flash player is not available?
In case Flash Player is not available on certain devices (like iPad and iPhone), FusionCharts JavaScript library automatically renders the same chart using JavaScript. If you are running the sample from local file system, please note that you will need to provide the data using Data String method, that is, passing the data (XML/JSON) to the chart as String or JSON Object. Many browsers restrict JavaScript from accessing local file system owing to security reasons. In the above example, since you had provided data as a URL, the JavaScript charts will not be able to access the same, when running locally. If you run the files from a server, it will run absolutely fine, though. When running locally, however, if you provide the data as string (using the Data String method), it works fine.
If for any reason, you do not see a chart, run through the following checks:
If you see an endless loading progress bar in your browser, or if the right click menu (right click at the place where the chart is supposed to be) shows "Movie not loaded", check the following:
- Whether you pasted the chart SWF files in FusionCharts folder of MyFirstChart folder?
- Whether you provided the SWF path properly in your HTML page?
- Do you have Adobe Flash Player 8 (or above) installed for this browser?
- Whether you enabled your browser to show Active X and Plugin controls? Normally, all browsers are Flash-enabled, but sometimes security settings can disable execution of Active X and Plugin controls.
If you get an "Error in Loading Data" message, check the following:
- Whether the XML file is in the same folder as the HTML file?
- Whether the XML file is named as Data.xml and not Data.xml.txt? (as many basic text editors append .txt after the file name)
If you get an "Invalid XML Data" message, it means that the XML data document is malformed. Check it again for common errors like:
- Difference in case of tags. <chart> should end with </chart> and not </Chart> or </CHART>
- Missing opening/closing quotation marks for any attributes, for example, <chart caption=Weekly Sales Summary' should be <chart caption='Weekly Sales Summary'
- Missing closing tag for any element
To check whether your final XML is correct, open it in your browser and you will see the error.
If only the text "FusionCharts XT will load here!" is displayed, check with the following:
- Whether you pasted the FusionCharts.js, jquery.min.js , FusionCharts.HC.js and FusionCharts.HC.Charts.js files in the FusionCharts folder of the MyFirstChart folder?
- Whether you included and provided the path of FusionCharts.js properly in your HTML page?
- Are there any JavaScript syntax or runtime errors that might have halted the execution of FusionCharts functions?
- Whether you have given different names for the chart's JavaScript variable and chart's ID?