<chart caption="Yearly Sales" xAxisName="Year" yAxisName="Sales"> <set label="2004" value="37800" link="newchart-xmlurl-Data2004.xml" /> <set label="2005" value="21900" link="newchart-xmlurl-Data2005.xml" /> <set label="2006" value="32900" link="newchart-xmlurl-Data2006.xml" /> <set label="2007" value="39800" link="newchart-xmlurl-Data2007.xml" /> </chart>
LinkedCharts is a new and smart drilldown feature introduced in FusionCharts v3.2 that allows you to create unlimited level of DrillDown charts using a single data source. All the links originate from a parent chart and its data, which comprehensively contains data or data URL for all descendant (child, grand-child) charts. Upon clicking the dataplot items (columns, pie etc.) of the parent chart, users can drill down into descendant charts. The descendant charts (or children charts) can either replace the parent chart with an option to drill up, or can be opened in new dialogs or frames.
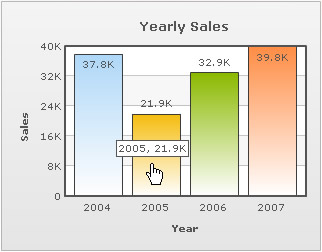
Let us consider a simple scenario with a single level of drilldown. We will build a parent chart that shows yearly sales, which when clicked will show quarterly sales for that year. Let us build the parent chart as a Column 2D chart with four columns (representing four years). LinkedCharts allows you to build these kind of scenarios (and much more complex) without having to write any additional line of code.
To use LinkedCharts, you need to follow these steps:
- First, create the XML/JSON data for parent chart. This is called the parent data source and comprehensively contains Data String or data URL for all descendant charts.
- Next, append the data string or data URL for all the descendant charts (also called child chart) within the parent data source. If data string method is used, data for each descendant chart is embedded within the parent data source and linked using unique data identifiers.
- You are done. Yes, no additional code is required!
The LinkedChart feature of FusionCharts JavaScript class will take care of the rest. It does the following:
- It automatically creates and shows a detailed child chart when a dataplot item link » (specially defined links using newchart prefix) in the parent chart is clicked
- It clones all chart configuration settings from the parent chart to create the child chart or the LinkedChart
- It also allows you to configure specific properties for the descendant charts » for example, type of chart, width, height, where the charts will be shown etc. using configureLink() function
- It notifies your code by way of events whenever a link is invoked, link item is opened and link item is closed
- It allows you to drill down to unlimited numbers of levels
The images below shows how a simple LinkedCharts implementation works (here, we have shown only one level of drilldown):
 |
 |
| Main chart with yearly sales data. Column of year 2005 is being clicked. |
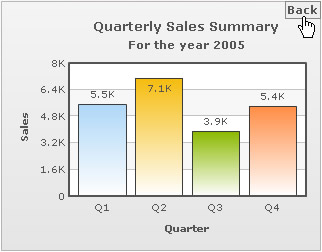
LinkedChart with data of 2005 replaces the main chart. Click on Back overlay button to return to the main chart. |
See it live!
While it was possible to create this using FusionCharts v3.1 (or previous versions) as well, you had to write additional code and handlers to make this possible. LinkedCharts helps you attain the same without an additional line of code.
In this page, we will learn LinkedCharts by doing the following:
- Create a basic LinkedChart which loads descendant (child) charts replacing the parent chart. The data of the child charts will be specified as data URL
- Create LinkedCharts with data for all child charts specified as data string (embedded inside the parent chart data source)
- Change configuration of descendant charts at different levels of drilldown ( here, we will change the chart type of the descendant charts)
- Open LinkedCharts in a separate HTML container
- Create LinkedCharts showing multiple levels of drill-down
Let us straight jump into code and see how LinkedCharts work.
HTML
For a very basic implementation, the HTML is exactly same as our first chart, weekly-sales which we created in Creating your first chart section. The HTML is as follows:
<html>
  <head>
    <title>My First chart using FusionCharts XT</title>
    <script type="text/javascript" src="FusionCharts/FusionCharts.js">
    </script>
  </head>
  <body>
    <div id="chartContainer">FusionCharts XT will load here!</div>
    <script type="text/javascript"><!--

      var myChart = new FusionCharts( "FusionCharts/Column2D.swf",
        "myChartId", "320", "250", "0", "1" );
      myChart.setXMLUrl("summary-data.xml");
      myChart.render("chartContainer");

    // -->
    </script>
  </body>
</html>
In the above HTML we have created only the parent chart. The chart takes data from an XML file, summary-data.xml. This chart, in junction with LinkedCharts functionality defined in FusionCharts.js, will drive DrillDown charts; without you having to write any additional line of code.
XML Data
The XML data is what drives the entire LinkedCharts drilldown functionality. In this example, we will use data URL method to specify URL of descendant charts. In context of XML data, it is called XML URL method. Given below is the XML data specifying LinkedChart for each column.
{
  "chart":{
    "caption":"Yearly Sales", "xaxisname":"Year", "yaxisname":"Sales" },
  "data":[
    { "label":"2004", "value":"37800", "link":"newchart-jsonurl-Data2004.json"  },
    { "label":"2005", "value":"21900", "link":"newchart-jsonurl-Data2005.json"  },
    { "label":"2006", "value":"32900", "link":"newchart-jsonurl-Data2006.json"  },
    { "label":"2007", "value":"39800", "link":"newchart-jsonurl-Data2007.json"  }
  ]
}
In the above XML we define link attribute for each <set> element. Note how link for each column is defined as newchart-xmlurl-DataURL. newChart prefix is used to indicate that it must invoke LinkedChart. xmlURL indicates that XML URL method is used to specify data for linked chart; in case of JSON data, jsonurl is used. URL specifies the data path for the linked chart that opens when this column is clicked.
As per the above XML, the data for the child chart which loads when first column is clicked, is Data2004.xml; Data2005.xml when the second column is clicked etc. Hence, for four columns in this sample there are four separate XML files from which the data for the detailed charts will be used. The four XML (and JSON) files are as follows:
<chart caption="Quarterly Sales Summary" subcaption="For the year 2004"
xAxisName="Quarter" yAxisName="Sales" >
   <set label="Q1" value="11700" />
   <set label="Q2" value="8600" />
   <set label="Q3" value="6900" />
   <set label="Q4" value="10600" />
</chart>
<chart caption="Quarterly Sales Summary" subcaption="For the year 2005"
xAxisName="Quarter" yAxisName="Sales">
  <set label="Q1" value="5500" />
  <set label="Q2" value="7100" />
  <set label="Q3" value="3900" />
  <set label="Q4" value="5400" />
</chart>
<chart caption="Quarterly Sales Summary" subcaption="For the year 2006"
xAxisName="Quarter" yAxisName="Sales">
  <set label="Q1" value="6700" />
  <set label="Q2" value="9200" />
  <set label="Q3" value="10800" />
  <set label="Q4" value="6200" />
</chart>
<chart caption="Quarterly Sales Summary" subcaption="For the year 2007"
xAxisName="Quarter" yAxisName="Sales">
  <set label="Q1" value="8900" />
  <set label="Q2" value="6600" />
  <set label="Q3" value="11200" />
  <set label="Q4" value="13100" />
</chart>
{
  "chart":{
    "caption":"Quarterly Sales Summary",
    "subcaption":"For the year 2004",
    "xaxisname":"Quarter",
    "yaxisname":"Sales",
    "showBorder" : "1"
  },
  "data":[
    { "label":"Q1", "value":"11700" },
    { "label":"Q2", "value":"8600" },
    { "label":"Q3", "value":"6900" },
    { "label":"Q4", "value":"10600" }
  ]
}
{
  "chart":{
    "caption":"Quarterly Sales Summary",
    "subcaption":"For the year 2005",
    "xaxisname":"Quarter",
    "yaxisname":"Sales",
    "showBorder" : "1"
  },
  "data":[
    { "label":"Q1", "value":"5500" },
    { "label":"Q2", "value":"7100" },
    { "label":"Q3", "value":"3900" },
    { "label":"Q4", "value":"5400" }
  ]
}
{
  "chart":{
    "caption":"Quarterly Sales Summary",
    "subcaption":"For the year 2006",
    "xaxisname":"Quarter",
    "yaxisname":"Sales",
    "showBorder" : "1"
  },
  "data":[
    { "label":"Q1", "value":"6700" },
    { "label":"Q2", "value":"9200" },
    { "label":"Q3", "value":"10800" },
    { "label":"Q4", "value":"6200" }
  ]
}
{
  "chart":{
    "caption":"Quarterly Sales Summary",
    "subcaption":"For the year 2007",
    "xaxisname":"Quarter",
    "yaxisname":"Sales",
    "showBorder" : "1"
  },
  "data":[
    { "label":"Q1", "value":"8900" },
    { "label":"Q2", "value":"6600" },
    { "label":"Q3", "value":"11200" },
    { "label":"Q4", "value":"13100" }
  ]
}
The page first loads the parent chart, a column chart with four years data. When a column (year) is clicked, the parent chart is replaced by a detailed child chart showing quarterly data for that particular year. There is a Back overlay button at the top right corner of the chart. This button when clicked leads us back to the main chart.
This is a very basic sample in which the parent chart is replaced by the child chart. However, there are a lot of things that you can configure, like the links from JavaScript (using configureLink function) such that the descendant charts get appended to the parent chart's container. You can also make the descendant charts open in a separate container. Using event listeners you can even extend the functionality to open the descendant charts in jQuery dialogs, light-boxes etc. You can also modify various aspects (like size, attribute etc.) of the parent chart as well as the opening descendant chart. Possibilities are endless. We explore some of the possibilities in the coming sections of this page.
Pointers on the XML's link attribute to implement LinkedCharts :
The format of the link attribute's value is : "newchart-dataformat-datasource". Here, newchart- is a constant. The values for dataformat and datasource are as follows:
- dataformat » (that is, value after newchart prefix and a hyphen (-) ) is the format in which data for the linked chart is provided. Data format can be of four types:
- xmlurl - This defines that the data for the new chart will come from an XML URL. This is automatically loaded by the linked chart.
- jsonurl - This defines that the data for the new chart will come from a JSON URL. This is automatically loaded by the linked chart
- xml - This defines that the data for the new chart will come from XML embedded inside the XML for the parent chart (parent data source)
- json - This defines that the data for the new chart will come from JSON embedded inside the JSON for the parent chart (parent data source)
- datasource » (the rest of the value, after a hyphen (-) again) defines the value for data source (either URL or data string itself) for the descendant chart as per the dataformat set:
- When xmlurl is set as the dataformat, the datasource value will be a URL of the XML file
- When jsonurl is set as the dataformat, the datasource value will be a URL of the JSON file
- When xml is set as the dataformat, the datasource assumes value of the unique data identifier which refers to the data embedded inside <linkeddata> node (that contains data for all descendant charts) in the parent data source for the descendant chart
- When json is set as the dataformat, the datasource assumes value of the unique data identifier which refers to the data embedded inside the Array linkeddata (that contains data for all descendant charts) in the parent data source for the descendant chart
You can embed the descendant data string in the parent data source. This is called data string method in context of LinkedCharts. Each dataplot item in parent chart is then linked to a descendant chart data (embedded in parent data source) by means of a unique data identifier. A sample XML and equivalent JSON is given below:
<chart caption="Yearly sales" xAxisName="Year" yAxisName="Sales">
  <set label="2004" value="37800" link="newchart-xml-2004-quarterly" />
  <set label="2005" value="21900" link="newchart-xml-2005-quarterly" />
  <set label="2006" value="32900" link="newchart-xml-2006-quarterly" />
  <set label="2007" value="39800" link="newchart-xml-2007-quarterly" />

  <linkeddata id="2004-quarterly">
    <chart caption="Quarterly Sales Summary" subcaption="For the year 2004"
    xAxisName="Quarter" yAxisName="Sales" >
       <set label="Q1" value="11700" />
       <set label="Q2" value="8600" />
       <set label="Q3" value="6900" />
       <set label="Q4" value="10600" />
    </chart>
  </linkeddata>

  <linkeddata id="2005-quarterly">
    <chart caption="Quarterly Sales Summary" subcaption="For the year 2005"
      xAxisName="Quarter" yAxisName="Sales">
       <set label="Q1" value="5500" />
       <set label="Q2" value="7100" />
       <set label="Q3" value="3900" />
       <set label="Q4" value="5400" />
    </chart>
  </linkeddata>

  <linkeddata id="2006-quarterly">
    <chart caption="Quarterly Sales Summary" subcaption="For the year 2006"
      xAxisName="Quarter" yAxisName="Sales">
       <set label="Q1" value="6700" />
       <set label="Q2" value="9200" />
       <set label="Q3" value="10800" />
       <set label="Q4" value="6200" />
    </chart>
  </linkeddata>

  <linkeddata id="2007-quarterly">
    <chart caption="Quarterly Sales Summary" subcaption="For the year 2007"
      xAxisName="Quarter" yAxisName="Sales">
      <set label="Q1" value="8900" />
      <set label="Q2" value="6600" />
      <set label="Q3" value="11200" />
      <set label="Q4" value="13100" />
     </chart>
  </linkeddata>

</chart>
{
  "chart":{
    "caption":"Yearly Sales", "xaxisname":"Year", "yaxisname":"Sales" },
  "data":[{
      "label":"2004", "value":"37800", "link":"newchart-json-2004-quarterly"
    },
    {
      "label":"2005","value":"21900", "link":"newchart-json-2005-quarterly"
    },
    {
      "label":"2006", "value":"32900", "link":"newchart-json-2006-quarterly"
    },
    {
      "label":"2007", "value":"39800", "link":"newchart-json-2007-quarterly"
    }
  ],
  "linkeddata":[{
      "id":"2004-quarterly",
      "linkedchart":{
        "chart":{
          "caption":"Quarterly Sales Summary",
          "subcaption":"For the year 2004",
          "xaxisname":"Quarter",
          "yaxisname":"Sales"
        },
        "data":[
          { "label":"Q1", "value":"11700" },
          { "label":"Q2", "value":"8600" },
          { "label":"Q3", "value":"6900" },
          { "label":"Q4", "value":"10600" }
        ]
      }
    },
    {
      "id":"2005-quarterly",
      "linkedchart":{
        "chart":{
          "caption":"Quarterly Sales Summary",
          "subcaption":"For the year 2005",
          "xaxisname":"Quarter",
          "yaxisname":"Sales"
        },
        "data":[
           { "label":"Q1", "value":"5500" },
           { "label":"Q2", "value":"7100" },
           { "label":"Q3", "value":"3900" },
           { "label":"Q4", "value":"5400" }
        ]
      }
    },
    {
      "id":"2006-quarterly",
      "linkedchart":{
        "chart":{
          "caption":"Quarterly Sales Summary",
          "subcaption":"For the year 2006",
          "xaxisname":"Quarter",
          "yaxisname":"Sales"
        },
        "data":[
           { "label":"Q1", "value":"6700" },
           { "label":"Q2", "value":"9200" },
           { "label":"Q3", "value":"10800" },
           { "label":"Q4", "value":"6200" }
        ]
      }
    },
    {
      "id":"2007-quarterly",
      "linkedchart":{
        "chart":{
          "caption":"Quarterly Sales Summary",
          "subcaption":"For the year 2007",
          "xaxisname":"Quarter",
          "yaxisname":"Sales"
        },
        "data":[
          { "label":"Q1", "value":"8900" },
          { "label":"Q2", "value":"6600" },
          { "label":"Q3", "value":"11200" },
          { "label":"Q4", "value":"13100" }
        ]
      }
    }
  ]
}
For detailed information of the XML/JSON structure of the LinkedCharts' data read FusionCharts XT data formats > XML and JSON pages.
Till now, we have seen how to use the standard LinkedCharts feature provided by FusionCharts XT. Here, the descendant charts used the same configuration and chart type as parent chart. However, FusionCharts JavaScript class allows you to configure each aspect of the descendant charts LinkedCharts using the function configureLink() for each chart instance. Using this function, you can pass all your desired configurations for the descendant charts.
You can pass all the properties that a FusionCharts constructor accepts. Additionally, you can also configure the overlay button using overlayButton property. In the sample JavaScript code given below we will change the chart type of the child charts to Pie3D and set custom colors for overlay-buttons. Note that for this example we will use the same data files that we have used in our basic LinkedChart sample above.The images below shows how it works:
| |
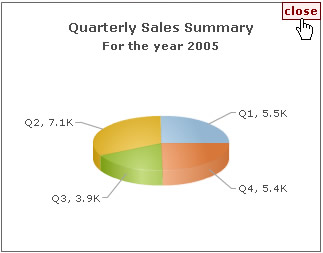 |
| Main chart with four year's sales data | LinkedChart as Pie3D and with customized overlay button |
See it live!
var myChart = new FusionCharts( "FusionCharts/Column2D.swf",
    "myChartId", "320", "250", "0", "1" );
  myChart.setXMLUrl("summary-data.xml");
  myChart.render("chartContainer");

  FusionCharts("myChartId").configureLink (
  {
    swfUrl : "../../../../Charts/Pie3D.swf",
    overlayButton:
    {
      message: 'close',
      fontColor : '880000',
      bgColor:'FFEEEE',
      borderColor: '660000'
    }
  }, 0);
In the above code :
- We have created a parent chart with ID myChartId. We have provided it the XML data that we had built earlier.
- Thereafter, to configure the descendant charts, we call configureLink function on the chart instance and to this function, we pass an Object as parameter.
- The object contains the property swfUrl with its value as the path to Pie3D.swf. This helps in configuring the descendant charts to show up as Pie Charts.
- We also setup the overlay button using overlayButton property. The settings are passed as an Object with possible properties as message, font, fontColor, fontSize, bold, padding, bgColor and borderColor.
Here we are doing the following:
- We set a new message "close" which replaces the default "Back" text of the button
- We set red fontColor, and a similar borderColor and bgColor (background color)
- We also pass the drilldown level to configure as the second parameter of the function (zero here). Zero denotes the first level of drilldown. The level value keeps increasing by one for subsequent levels of drilldown.
Note that you can pass all the properties that a FusionCharts constructor accepts as the property of the parameter of configureLink function. To know the properties for overlayButton read overlayButton property list.
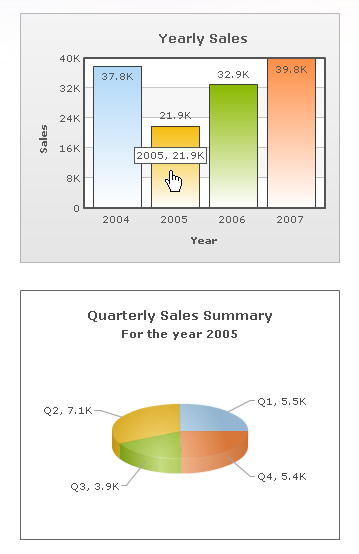
Now let us modify the above code and the HTML a bit so that we can render the descendant charts in a separate HTML container. This will help us retain the parent chart as well as show the child charts separately. The changes are as follows:
In the HTML we added a new DIV with "linkedchart-container" as ID just below the existing chart container DIV. This new DIV will be the container for the descendant charts.
<div id="chartContainer">Parent chart will load here</div>

<div id="linkedchart-container" >Descendant charts will load here</div>
FusionCharts("myChartId").configureLink (
  {
    swfUrl : "../../../../Charts/Pie3D.swf",
    "renderAt" : "linkedchart-container",
    overlayButton: { show : false }
  }, 0 );
In JavaScript's configureLink function we do a bit of modifications as described below:
- We add renderAt property and set the value to "linkedchart-container" where the LinkedCharts will be generated
- We set the overlay button off by setting the show property to false
Once run, the functionality will work somehow like the image shown below:
Now let us create a sample where we will drill down from an yearly data to weekly data in three drilldown steps. Hence, the first drilldown level will show quarterly data for a particular year. The next level will show monthly data for a selected quarter. Finally, the last drilldown level will show weekly data for the selected month.
For this we will use only a single data source which contains data for all the descent charts for all drilldown levels.
We will also learn how to configure each level of descendant chart using configureLink() function.
The HTML will be again fairly simple as shown below:
<html>
  <head>
    <title>Multi-level LinkedCharts</title>
    <script type="text/javascript" src="FusionCharts/FusionCharts.js">
    </script>
  </head>
  <body>
    <div id="parentChartContainer" >Loading FusionCharts XT!</div>
    <div id="weeklyChartContainer" ></div>
    <script type="text/javascript" ><!--

      var rootChart = new FusionCharts( "../../../../Charts/Column2D.swf", "myChartId", "680", "250", "0", "1" );
      rootChart.setXMLUrl( "MuliLevelLinkedData.xml" );
      rootChart.render( "parentChartContainer" );

      rootChart.configureLink
     (
        [
          { overlayButton: { message: ' � Annual Sales'   } },
          { overlayButton: { message: ' � Quarterly Sales'} },
          {
            swfUrl: '../../../../Charts/Pie3D.swf',
            width: '225', height: '200',
            renderAt: 'weeklyChartContainer',
            insertMode: 'append',
            overlayButton: { message: 'Close' }
          }
        ]
      );

    // -->
    </script>
  </body>
</html>
In the above code we have done the following:
- Created a Column2D chart (which will act as the parent chart)
- Configured each LinkedChart's drilldown level calling configureLink() function. In this function instead of an Object we have passed an Array. Each array element is an Object containing descendant chart configuration for each level. Each level is denoted by the index value of the Array. Hence, zero denotes the first level of drilldown, one being the second level and so on. The configuration that we did for each level is as follows:
- For first-level we set the overlay button's message to " « Annual Sales". Since, the first-level will be a drilled down chart from the Annual Sales chart, this message hints at going back to the Annual Sales chart.
- For second-level we set the overlay button's message to " « Quarterly Sales". Since, the second level will be a drilled down chart from the Quarterly Sales chart, this message hints at going back to the Quarterly Sales chart.
- For the final or third-level we configure a lot more. We change the chart SWF and set swfUrl to Pie3D.swf. We change the width and height of the chat. We set a different div where the chart of this level will be rendered. Moreover, we set that the chart will not replace the existing content of the container element. Rather the chart will be appended (insertMode: 'append') into the existing content. This will make the container filled up with charts, unless charts of this level are not closed.
With these configurations set, let us see how we define the data for each level in a single data source. The XML data source as well as the equivalent JSON data source are shown below:
<chart caption="Annual Sales Summary" subcaption="For the period of 2004 to 2007"
xAxisName="Year" yAxisName="Sales" numberPrefix="$" useRoundEdges="1">
<set label="2004" value="11610" link="newchart-xml-2004Quarters" tooltext="2004, $11.61K{br}click to see details" />
<set label="2005" value="10430" link="newchart-xml-2005Quarters" tooltext="2005, $10.43K{br}click to see details" />
<set label="2006" value="10170" link="newchart-xml-2006Quarters" tooltext="2006, $10.17K{br}click to see details" />
<set label="2007" value="11560" link="newchart-xml-2007Quarters" tooltext="2007, $11.56K{br}click to see details" />
<linkeddata id="2004Quarters">
<chart caption="Quarterly Sales Summary" subcaption="For the year 2004"
xAxisName="Quarter" yAxisName="Sales" numberPrefix="$" useRoundEdges="1" >
<set label="Q1" value="2740" link="newchart-xml-2004Q1"/>
<set label="Q2" value="2700" link="newchart-xml-2004Q2"/>
<set label="Q3" value="3180" link="newchart-xml-2004Q3"/>
<set label="Q4" value="2990" link="newchart-xml-2004Q4"/>
<linkeddata id="2004Q1">
<chart caption="Monthly Sales Summary" subcaption="For the first quarter of year 2004"
xAxisName="Month" yAxisName="Sales" numberPrefix="$" useRoundEdges="1" >
<set label="January" value="1100" link="newchart-xml-2004Jan" />
<set label="February" value="760" link="newchart-xml-2004Feb" />
<set label="March" value="880" link="newchart-xml-2004Mar" />
<linkeddata id="2004Jan">
<chart caption="Weekly Sales Summary" subcaption="For January 2004" showLabels="0" showLegend="1" pieSliceDepth="10" enableSmartLabels="0" labelDistance="2"
numberPrefix="$" bgColor="CBCBCB,E9E9E9" bgAlpha="50,50" bgRatio="0,100" bgAngle="270" showBorder="1" borderColor="767575" borderAlpha="50">
<set label="Week 1" value="170" />
<set label="Week 2" value="290" />
<set label="Week 3" value="320" />
<set label="Week 4" value="320" />
</chart>
</linkeddata>
<linkeddata id="2004Feb">
<chart caption="Weekly Sales Summary" subcaption="For February 2004" showLabels="0" showLegend="1" pieSliceDepth="10" enableSmartLabels="0" labelDistance="2"
numberPrefix="$" bgColor="CBCBCB,E9E9E9" bgAlpha="50,50" bgRatio="0,100" bgAngle="270" showBorder="1" borderColor="767575" borderAlpha="50">
<set label="Week 1" value="100" />
<set label="Week 2" value="90" />
<set label="Week 3" value="370" />
<set label="Week 4" value="200" />
</chart>
</linkeddata>
<linkeddata id="2004Mar">
<chart caption="Weekly Sales Summary" subcaption="For March 2004" showLabels="0" showLegend="1" pieSliceDepth="10" enableSmartLabels="0" labelDistance="2"
numberPrefix="$" bgColor="CBCBCB,E9E9E9" bgAlpha="50,50" bgRatio="0,100" bgAngle="270" showBorder="1" borderColor="767575" borderAlpha="50">
<set label="Week 1" value="270" />
<set label="Week 2" value="90" />
<set label="Week 3" value="200" />
<set label="Week 4" value="320" />
</chart>
</linkeddata>
</chart>
</linkeddata>
<linkeddata id="2004Q2">
<chart caption="Monthly Sales Summary" subcaption="For the second quarter of year 2004"
xAxisName="Month" yAxisName="Sales" numberPrefix="$" useRoundEdges="1" >
<set label="April" value="1160" link="newchart-xml-2004Apr" />
<set label="May" value="920" link="newchart-xml-2004May" />
<set label="June" value="620" link="newchart-xml-2004Jun" />
<linkeddata id="2004Apr">
<chart caption="Weekly Sales Summary" subcaption="For April 2004" showLabels="0" showLegend="1" pieSliceDepth="10" enableSmartLabels="0" labelDistance="2"
numberPrefix="$" bgColor="CBCBCB,E9E9E9" bgAlpha="50,50" bgRatio="0,100" bgAngle="270" showBorder="1" borderColor="767575" borderAlpha="50">
<set label="Week 1" value="350" />
<set label="Week 2" value="290" />
<set label="Week 3" value="320" />
<set label="Week 4" value="200" />
</chart>
</linkeddata>
<linkeddata id="2004May">
<chart caption="Weekly Sales Summary" subcaption="For May 2004" showLabels="0" showLegend="1" pieSliceDepth="10" enableSmartLabels="0" labelDistance="2"
numberPrefix="$" bgColor="CBCBCB,E9E9E9" bgAlpha="50,50" bgRatio="0,100" bgAngle="270" showBorder="1" borderColor="767575" borderAlpha="50">
<set label="Week 1" value="80" />
<set label="Week 2" value="290" />
<set label="Week 3" value="400" />
<set label="Week 4" value="150" />
</chart>
</linkeddata>
<linkeddata id="2004Jun">
<chart caption="Weekly Sales Summary" subcaption="For June 2004" showLabels="0" showLegend="1" pieSliceDepth="10" enableSmartLabels="0" labelDistance="2"
numberPrefix="$" bgColor="CBCBCB,E9E9E9" bgAlpha="50,50" bgRatio="0,100" bgAngle="270" showBorder="1" borderColor="767575" borderAlpha="50">
<set label="Week 1" value="210" />
<set label="Week 2" value="90" />
<set label="Week 3" value="200" />
<set label="Week 4" value="120" />
</chart>
</linkeddata>
</chart>
</linkeddata>
<linkeddata id="2004Q3">
<chart caption="Monthly Sales Summary" subcaption="For the third quarter of year 2004"
xAxisName="Month" yAxisName="Sales" numberPrefix="$" useRoundEdges="1" >
<set label="July" value="1140" link="newchart-xml-2004Jul" />
<set label="August" value="860" link="newchart-xml-2004Aug" />
<set label="September" value="1180" link="newchart-xml-2004Sep" />
<linkeddata id="2004Jul">
<chart caption="Weekly Sales Summary" subcaption="For July 2004" showLabels="0" showLegend="1" pieSliceDepth="10" enableSmartLabels="0" labelDistance="2"
numberPrefix="$" bgColor="CBCBCB,E9E9E9" bgAlpha="50,50" bgRatio="0,100" bgAngle="270" showBorder="1" borderColor="767575" borderAlpha="50">
<set label="Week 1" value="400" />
<set label="Week 2" value="290" />
<set label="Week 3" value="150" />
<set label="Week 4" value="300" />
</chart>
</linkeddata>
<linkeddata id="2004Aug">
<chart caption="Weekly Sales Summary" subcaption="For August 2004" showLabels="0" showLegend="1" pieSliceDepth="10" enableSmartLabels="0" labelDistance="2"
numberPrefix="$" bgColor="CBCBCB,E9E9E9" bgAlpha="50,50" bgRatio="0,100" bgAngle="270" showBorder="1" borderColor="767575" borderAlpha="50">
<set label="Week 1" value="310" />
<set label="Week 2" value="250" />
<set label="Week 3" value="100" />
<set label="Week 4" value="200" />
</chart>
</linkeddata>
<linkeddata id="2004Sep">
<chart caption="Weekly Sales Summary" subcaption="For September 2004" showLabels="0" showLegend="1" pieSliceDepth="10" enableSmartLabels="0" labelDistance="2"
numberPrefix="$" bgColor="CBCBCB,E9E9E9" bgAlpha="50,50" bgRatio="0,100" bgAngle="270" showBorder="1" borderColor="767575" borderAlpha="50">
<set label="Week 1" value="370" />
<set label="Week 2" value="290" />
<set label="Week 3" value="200" />
<set label="Week 4" value="320" />
</chart>
</linkeddata>
</chart>
</linkeddata>
<linkeddata id="2004Q4">
<chart caption="Monthly Sales Summary" subcaption="For the fourth quarter of year 2004"
xAxisName="Month" yAxisName="Sales" numberPrefix="$" useRoundEdges="1" >
<set label="October" value="920" link="newchart-xml-2004Oct" />
<set label="November" value="1020" link="newchart-xml-2004Nov" />
<set label="December" value="1050" link="newchart-xml-2004Dec" />
<linkeddata id="2004Oct">
<chart caption="Weekly Sales Summary" subcaption="For October 2004" showLabels="0" showLegend="1" pieSliceDepth="10" enableSmartLabels="0" labelDistance="2"
numberPrefix="$" bgColor="CBCBCB,E9E9E9" bgAlpha="50,50" bgRatio="0,100" bgAngle="270" showBorder="1" borderColor="767575" borderAlpha="50">
<set label="Week 1" value="250" />
<set label="Week 2" value="200" />
<set label="Week 3" value="70" />
<set label="Week 4" value="400" />
</chart>
</linkeddata>
<linkeddata id="2004Nov">
<chart caption="Weekly Sales Summary" subcaption="For November 2004" showLabels="0" showLegend="1" pieSliceDepth="10" enableSmartLabels="0" labelDistance="2"
numberPrefix="$" bgColor="CBCBCB,E9E9E9" bgAlpha="50,50" bgRatio="0,100" bgAngle="270" showBorder="1" borderColor="767575" borderAlpha="50">
<set label="Week 1" value="400" />
<set label="Week 2" value="100" />
<set label="Week 3" value="200" />
<set label="Week 4" value="320" />
</chart>
</linkeddata>
<linkeddata id="2004Dec">
<chart caption="Weekly Sales Summary" subcaption="For December 2004" showLabels="0" showLegend="1" pieSliceDepth="10" enableSmartLabels="0" labelDistance="2"
numberPrefix="$" bgColor="CBCBCB,E9E9E9" bgAlpha="50,50" bgRatio="0,100" bgAngle="270" showBorder="1" borderColor="767575" borderAlpha="50">
<set label="Week 1" value="400" />
<set label="Week 2" value="150" />
<set label="Week 3" value="300" />
<set label="Week 4" value="200" />
</chart>
</linkeddata>
</chart>
</linkeddata>
</chart>
</linkeddata>
<linkeddata id="2005Quarters">
<chart caption="Quarterly Sales Summary" subcaption="For the year 2005"
xAxisName="Quarter" yAxisName="Sales" numberPrefix="$" useRoundEdges="1" >
<set label="Q1" value="3060" link="newchart-xml-2005Q1"/>
<set label="Q2" value="2030" link="newchart-xml-2005Q2"/>
<set label="Q3" value="2700" link="newchart-xml-2005Q3"/>
<set label="Q4" value="2640" link="newchart-xml-2005Q4"/>
<linkeddata id="2005Q1">
<chart caption="Monthly Sales Summary" subcaption="For the first quarter of year 2005"
xAxisName="Month" yAxisName="Sales" numberPrefix="$" useRoundEdges="1" >
<set label="January" value="3700" link="newchart-xml-2004Jan" />
<set label="February" value="2900" link="newchart-xml-2004Feb" />
<set label="March" value="3200" link="newchart-xml-2004Mar" />
<linkeddata id="2005Jan">
<chart caption="Weekly Sales Summary" subcaption="For January 2005" showLabels="0" showLegend="1" pieSliceDepth="10" enableSmartLabels="0" labelDistance="2"
numberPrefix="$" bgColor="CBCBCB,E9E9E9" bgAlpha="50,50" bgRatio="0,100" bgAngle="270" showBorder="1" borderColor="767575" borderAlpha="50">
<set label="Week 1" value="450" />
<set label="Week 2" value="290" />
<set label="Week 3" value="380" />
<set label="Week 4" value="320" />
</chart>
</linkeddata>
<linkeddata id="2005Feb">
<chart caption="Weekly Sales Summary" subcaption="For February 2005" showLabels="0" showLegend="1" pieSliceDepth="10" enableSmartLabels="0" labelDistance="2"
numberPrefix="$" bgColor="CBCBCB,E9E9E9" bgAlpha="50,50" bgRatio="0,100" bgAngle="270" showBorder="1" borderColor="767575" borderAlpha="50">
<set label="Week 1" value="100" />
<set label="Week 2" value="200" />
<set label="Week 3" value="100" />
<set label="Week 4" value="320" />
</chart>
</linkeddata>
<linkeddata id="2005Mar">
<chart caption="Weekly Sales Summary" subcaption="For March 2005" showLabels="0" showLegend="1" pieSliceDepth="10" enableSmartLabels="0" labelDistance="2"
numberPrefix="$" bgColor="CBCBCB,E9E9E9" bgAlpha="50,50" bgRatio="0,100" bgAngle="270" showBorder="1" borderColor="767575" borderAlpha="50">
<set label="Week 1" value="120" />
<set label="Week 2" value="280" />
<set label="Week 3" value="300" />
<set label="Week 4" value="200" />
</chart>
</linkeddata>
</chart>
</linkeddata>
<linkeddata id="2005Q2">
<chart caption="Monthly Sales Summary" subcaption="For the second quarter of year 2005"
xAxisName="Month" yAxisName="Sales" numberPrefix="$" useRoundEdges="1" >
<set label="April" value="3700" link="newchart-xml-2005Apr" />
<set label="May" value="2900" link="newchart-xml-2005May" />
<set label="June" value="3200" link="newchart-xml-2005Jun" />
<linkeddata id="2005Apr">
<chart caption="Weekly Sales Summary" subcaption="For April 2005" showLabels="0" showLegend="1" pieSliceDepth="10" enableSmartLabels="0" labelDistance="2"
numberPrefix="$" bgColor="CBCBCB,E9E9E9" bgAlpha="50,50" bgRatio="0,100" bgAngle="270" showBorder="1" borderColor="767575" borderAlpha="50">
<set label="Week 1" value="170" />
<set label="Week 2" value="200" />
<set label="Week 3" value="80" />
<set label="Week 4" value="300" />
</chart>
</linkeddata>
<linkeddata id="2005May">
<chart caption="Weekly Sales Summary" subcaption="For May 2005" showLabels="0" showLegend="1" pieSliceDepth="10" enableSmartLabels="0" labelDistance="2"
numberPrefix="$" bgColor="CBCBCB,E9E9E9" bgAlpha="50,50" bgRatio="0,100" bgAngle="270" showBorder="1" borderColor="767575" borderAlpha="50">
<set label="Week 1" value="100" />
<set label="Week 2" value="200" />
<set label="Week 3" value="300" />
<set label="Week 4" value="80" />
</chart>
</linkeddata>
<linkeddata id="2005Jun">
<chart caption="Weekly Sales Summary" subcaption="For June 2005" showLabels="0" showLegend="1" pieSliceDepth="10" enableSmartLabels="0" labelDistance="2"
numberPrefix="$" bgColor="CBCBCB,E9E9E9" bgAlpha="50,50" bgRatio="0,100" bgAngle="270" showBorder="1" borderColor="767575" borderAlpha="50">
<set label="Week 1" value="150" />
<set label="Week 2" value="50" />
<set label="Week 3" value="100" />
<set label="Week 4" value="300" />
</chart>
</linkeddata>
</chart>
</linkeddata>
<linkeddata id="2005Q3">
<chart caption="Monthly Sales Summary" subcaption="For the third quarter of year 2005"
xAxisName="Month" yAxisName="Sales" numberPrefix="$" useRoundEdges="1" >
<set label="July" value="3700" link="newchart-xml-2005Jul" />
<set label="August" value="2900" link="newchart-xml-2005Aug" />
<set label="September" value="3200" link="newchart-xml-2005Sep" />
<linkeddata id="2005Jul">
<chart caption="Weekly Sales Summary" subcaption="For July 2005" showLabels="0" showLegend="1" pieSliceDepth="10" enableSmartLabels="0" labelDistance="2"
numberPrefix="$" bgColor="CBCBCB,E9E9E9" bgAlpha="50,50" bgRatio="0,100" bgAngle="270" showBorder="1" borderColor="767575" borderAlpha="50">
<set label="Week 1" value="100" />
<set label="Week 2" value="230" />
<set label="Week 3" value="200" />
<set label="Week 4" value="120" />
</chart>
</linkeddata>
<linkeddata id="2005Aug">
<chart caption="Weekly Sales Summary" subcaption="For August 2005" showLabels="0" showLegend="1" pieSliceDepth="10" enableSmartLabels="0" labelDistance="2"
numberPrefix="$" bgColor="CBCBCB,E9E9E9" bgAlpha="50,50" bgRatio="0,100" bgAngle="270" showBorder="1" borderColor="767575" borderAlpha="50">
<set label="Week 1" value="300" />
<set label="Week 2" value="290" />
<set label="Week 3" value="220" />
<set label="Week 4" value="100" />
</chart>
</linkeddata>
<linkeddata id="2005Sep">
<chart caption="Weekly Sales Summary" subcaption="For September 2005" showLabels="0" showLegend="1" pieSliceDepth="10" enableSmartLabels="0" labelDistance="2"
numberPrefix="$" bgColor="CBCBCB,E9E9E9" bgAlpha="50,50" bgRatio="0,100" bgAngle="270" showBorder="1" borderColor="767575" borderAlpha="50">
<set label="Week 1" value="300" />
<set label="Week 2" value="190" />
<set label="Week 3" value="350" />
<set label="Week 4" value="400" />
</chart>
</linkeddata>
</chart>
</linkeddata>
<linkeddata id="2005Q4">
<chart caption="Monthly Sales Summary" subcaption="For the fourth quarter of year 2005"
xAxisName="Month" yAxisName="Sales" numberPrefix="$" useRoundEdges="1" >
<set label="October" value="3700" link="newchart-xml-2005Oct" />
<set label="November" value="2900" link="newchart-xml-2005Nov" />
<set label="December" value="3200" link="newchart-xml-2005Dec" />
<linkeddata id="2005Oct">
<chart caption="Weekly Sales Summary" subcaption="For October 2005" showLabels="0" showLegend="1" pieSliceDepth="10" enableSmartLabels="0" labelDistance="2"
numberPrefix="$" bgColor="CBCBCB,E9E9E9" bgAlpha="50,50" bgRatio="0,100" bgAngle="270" showBorder="1" borderColor="767575" borderAlpha="50">
<set label="Week 1" value="110" />
<set label="Week 2" value="190" />
<set label="Week 3" value="400" />
<set label="Week 4" value="200" />
</chart>
</linkeddata>
<linkeddata id="2005Nov">
<chart caption="Weekly Sales Summary" subcaption="For November 2005" showLabels="0" showLegend="1" pieSliceDepth="10" enableSmartLabels="0" labelDistance="2"
numberPrefix="$" bgColor="CBCBCB,E9E9E9" bgAlpha="50,50" bgRatio="0,100" bgAngle="270" showBorder="1" borderColor="767575" borderAlpha="50">
<set label="Week 1" value="200" />
<set label="Week 2" value="260" />
<set label="Week 3" value="120" />
<set label="Week 4" value="250" />
</chart>
</linkeddata>
<linkeddata id="2005Dec">
<chart caption="Weekly Sales Summary" subcaption="For December 2005" showLabels="0" showLegend="1" pieSliceDepth="10" enableSmartLabels="0" labelDistance="2"
numberPrefix="$" bgColor="CBCBCB,E9E9E9" bgAlpha="50,50" bgRatio="0,100" bgAngle="270" showBorder="1" borderColor="767575" borderAlpha="50">
<set label="Week 1" value="300" />
<set label="Week 2" value="290" />
<set label="Week 3" value="200" />
<set label="Week 4" value="120" />
</chart>
</linkeddata>
</chart>
</linkeddata>
</chart>
</linkeddata>
<linkeddata id="2006Quarters">
<chart caption="Quarterly Sales Summary" subcaption="For the year 2006"
xAxisName="Quarter" yAxisName="Sales" numberPrefix="$" useRoundEdges="1" >
<set label="Q1" value="2410" link="newchart-xml-2006Q1"/>
<set label="Q2" value="2800" link="newchart-xml-2006Q2"/>
<set label="Q3" value="2550" link="newchart-xml-2006Q3"/>
<set label="Q4" value="2410" link="newchart-xml-2006Q4"/>
<linkeddata id="2006Q1">
<chart caption="Monthly Sales Summary" subcaption="For the first quarter of year 2006"
xAxisName="Month" yAxisName="Sales" numberPrefix="$" useRoundEdges="1" >
<set label="January" value="870" link="newchart-xml-2006Jan" />
<set label="February" value="890" link="newchart-xml-2006Feb" />
<set label="March" value="650" link="newchart-xml-2006Mar" />
<linkeddata id="2006Jan">
<chart caption="Weekly Sales Summary" subcaption="For January 2006" showLabels="0" showLegend="1" pieSliceDepth="10" enableSmartLabels="0" labelDistance="2"
numberPrefix="$" bgColor="CBCBCB,E9E9E9" bgAlpha="50,50" bgRatio="0,100" bgAngle="270" showBorder="1" borderColor="767575" borderAlpha="50">
<set label="Week 1" value="370" />
<set label="Week 2" value="200" />
<set label="Week 3" value="100" />
<set label="Week 4" value="200" />
</chart>
</linkeddata>
<linkeddata id="2006Feb">
<chart caption="Weekly Sales Summary" subcaption="For February 2006" showLabels="0" showLegend="1" pieSliceDepth="10" enableSmartLabels="0" labelDistance="2"
numberPrefix="$" bgColor="CBCBCB,E9E9E9" bgAlpha="50,50" bgRatio="0,100" bgAngle="270" showBorder="1" borderColor="767575" borderAlpha="50">
<set label="Week 1" value="100" />
<set label="Week 2" value="390" />
<set label="Week 3" value="200" />
<set label="Week 4" value="200" />
</chart>
</linkeddata>
<linkeddata id="2006Mar">
<chart caption="Weekly Sales Summary" subcaption="For March 2006" showLabels="0" showLegend="1" pieSliceDepth="10" enableSmartLabels="0" labelDistance="2"
numberPrefix="$" bgColor="CBCBCB,E9E9E9" bgAlpha="50,50" bgRatio="0,100" bgAngle="270" showBorder="1" borderColor="767575" borderAlpha="50">
<set label="Week 1" value="80" />
<set label="Week 2" value="250" />
<set label="Week 3" value="200" />
<set label="Week 4" value="120" />
</chart>
</linkeddata>
</chart>
</linkeddata>
<linkeddata id="2006Q2">
<chart caption="Monthly Sales Summary" subcaption="For the second quarter of year 2006"
xAxisName="Month" yAxisName="Sales" numberPrefix="$" useRoundEdges="1" >
<set label="April" value="1300" link="newchart-xml-2006Apr" />
<set label="May" value="440" link="newchart-xml-2006May" />
<set label="June" value="1060" link="newchart-xml-2006Jun" />
<linkeddata id="2006Apr">
<chart caption="Weekly Sales Summary" subcaption="For April 2006" showLabels="0" showLegend="1" pieSliceDepth="10" enableSmartLabels="0" labelDistance="2"
numberPrefix="$" bgColor="CBCBCB,E9E9E9" bgAlpha="50,50" bgRatio="0,100" bgAngle="270" showBorder="1" borderColor="767575" borderAlpha="50">
<set label="Week 1" value="370" />
<set label="Week 2" value="290" />
<set label="Week 3" value="320" />
<set label="Week 4" value="320" />
</chart>
</linkeddata>
<linkeddata id="2006May">
<chart caption="Weekly Sales Summary" subcaption="For May 2006" showLabels="0" showLegend="1" pieSliceDepth="10" enableSmartLabels="0" labelDistance="2"
numberPrefix="$" bgColor="CBCBCB,E9E9E9" bgAlpha="50,50" bgRatio="0,100" bgAngle="270" showBorder="1" borderColor="767575" borderAlpha="50">
<set label="Week 1" value="90" />
<set label="Week 2" value="100" />
<set label="Week 3" value="200" />
<set label="Week 4" value="50" />
</chart>
</linkeddata>
<linkeddata id="2006Jun">
<chart caption="Weekly Sales Summary" subcaption="For June 2006" showLabels="0" showLegend="1" pieSliceDepth="10" enableSmartLabels="0" labelDistance="2"
numberPrefix="$" bgColor="CBCBCB,E9E9E9" bgAlpha="50,50" bgRatio="0,100" bgAngle="270" showBorder="1" borderColor="767575" borderAlpha="50">
<set label="Week 1" value="370" />
<set label="Week 2" value="290" />
<set label="Week 3" value="300" />
<set label="Week 4" value="100" />
</chart>
</linkeddata>
</chart>
</linkeddata>
<linkeddata id="2006Q3">
<chart caption="Monthly Sales Summary" subcaption="For the third quarter of year 2006"
xAxisName="Month" yAxisName="Sales" numberPrefix="$" useRoundEdges="1" >
<set label="July" value="850" link="newchart-xml-2006Jul" />
<set label="August" value="1030" link="newchart-xml-2006Aug" />
<set label="September" value="670" link="newchart-xml-2006Sep" />
<linkeddata id="2006Jul">
<chart caption="Weekly Sales Summary" subcaption="For July 2006" showLabels="0" showLegend="1" pieSliceDepth="10" enableSmartLabels="0" labelDistance="2"
numberPrefix="$" bgColor="CBCBCB,E9E9E9" bgAlpha="50,50" bgRatio="0,100" bgAngle="270" showBorder="1" borderColor="767575" borderAlpha="50">
<set label="Week 1" value="200" />
<set label="Week 2" value="100" />
<set label="Week 3" value="250" />
<set label="Week 4" value="300" />
</chart>
</linkeddata>
<linkeddata id="2006Aug">
<chart caption="Weekly Sales Summary" subcaption="For August 2006" showLabels="0" showLegend="1" pieSliceDepth="10" enableSmartLabels="0" labelDistance="2"
numberPrefix="$" bgColor="CBCBCB,E9E9E9" bgAlpha="50,50" bgRatio="0,100" bgAngle="270" showBorder="1" borderColor="767575" borderAlpha="50">
<set label="Week 1" value="370" />
<set label="Week 2" value="90" />
<set label="Week 3" value="400" />
<set label="Week 4" value="170" />
</chart>
</linkeddata>
<linkeddata id="2006Sep">
<chart caption="Weekly Sales Summary" subcaption="For September 2006" showLabels="0" showLegend="1" pieSliceDepth="10" enableSmartLabels="0" labelDistance="2"
numberPrefix="$" bgColor="CBCBCB,E9E9E9" bgAlpha="50,50" bgRatio="0,100" bgAngle="270" showBorder="1" borderColor="767575" borderAlpha="50">
<set label="Week 1" value="100" />
<set label="Week 2" value="290" />
<set label="Week 3" value="80" />
<set label="Week 4" value="200" />
</chart>
</linkeddata>
</chart>
</linkeddata>
<linkeddata id="2006Q4">
<chart caption="Monthly Sales Summary" subcaption="For the fourth quarter of year 2006"
xAxisName="Month" yAxisName="Sales" numberPrefix="$" useRoundEdges="1" >
<set label="October" value="590" link="newchart-xml-2006Oct" />
<set label="November" value="690" link="newchart-xml-2006Nov" />
<set label="December" value="1130" link="newchart-xml-2006Dec" />
<linkeddata id="2006Oct">
<chart caption="Weekly Sales Summary" subcaption="For October 2006" showLabels="0" showLegend="1" pieSliceDepth="10" enableSmartLabels="0" labelDistance="2"
numberPrefix="$" bgColor="CBCBCB,E9E9E9" bgAlpha="50,50" bgRatio="0,100" bgAngle="270" showBorder="1" borderColor="767575" borderAlpha="50">
<set label="Week 1" value="100" />
<set label="Week 2" value="120" />
<set label="Week 3" value="300" />
<set label="Week 4" value="70" />
</chart>
</linkeddata>
<linkeddata id="2006Nov">
<chart caption="Weekly Sales Summary" subcaption="For November 2006" showLabels="0" showLegend="1" pieSliceDepth="10" enableSmartLabels="0" labelDistance="2"
numberPrefix="$" bgColor="CBCBCB,E9E9E9" bgAlpha="50,50" bgRatio="0,100" bgAngle="270" showBorder="1" borderColor="767575" borderAlpha="50">
<set label="Week 1" value="200" />
<set label="Week 2" value="90" />
<set label="Week 3" value="300" />
<set label="Week 4" value="100" />
</chart>
</linkeddata>
<linkeddata id="2006Dec">
<chart caption="Weekly Sales Summary" subcaption="For December 2006" showLabels="0" showLegend="1" pieSliceDepth="10" enableSmartLabels="0" labelDistance="2"
numberPrefix="$" bgColor="CBCBCB,E9E9E9" bgAlpha="50,50" bgRatio="0,100" bgAngle="270" showBorder="1" borderColor="767575" borderAlpha="50">
<set label="Week 1" value="320" />
<set label="Week 2" value="290" />
<set label="Week 3" value="320" />
<set label="Week 4" value="200" />
</chart>
</linkeddata>
</chart>
</linkeddata>
</chart>
</linkeddata>
<linkeddata id="2007Quarters">
<chart caption="Quarterly Sales Summary" subcaption="For the year 2007"
xAxisName="Quarter" yAxisName="Sales" numberPrefix="$" useRoundEdges="1" >
<set label="Q1" value="2690" link="newchart-xml-2007Q1"/>
<set label="Q2" value="2700" link="newchart-xml-2007Q2"/>
<set label="Q3" value="3180" link="newchart-xml-2007Q3"/>
<set label="Q4" value="2990" link="newchart-xml-2007Q4"/>
<linkeddata id="2007Q1">
<chart caption="Monthly Sales Summary" subcaption="For the first quarter of year 2007"
xAxisName="Month" yAxisName="Sales" numberPrefix="$" useRoundEdges="1" >
<set label="January" value="1050" link="newchart-xml-2007Jan" />
<set label="February" value="760" link="newchart-xml-2007Feb" />
<set label="March" value="880" link="newchart-xml-2007Mar" />
<linkeddata id="2007Jan">
<chart caption="Weekly Sales Summary" subcaption="For January 2007" showLabels="0" showLegend="1" pieSliceDepth="10" enableSmartLabels="0" labelDistance="2"
numberPrefix="$" bgColor="CBCBCB,E9E9E9" bgAlpha="50,50" bgRatio="0,100" bgAngle="270" showBorder="1" borderColor="767575" borderAlpha="50">
<set label="Week 1" value="120" />
<set label="Week 2" value="290" />
<set label="Week 3" value="320" />
<set label="Week 4" value="320" />
</chart>
</linkeddata>
<linkeddata id="2007Feb">
<chart caption="Weekly Sales Summary" subcaption="For February 2007" showLabels="0" showLegend="1" pieSliceDepth="10" enableSmartLabels="0" labelDistance="2"
numberPrefix="$" bgColor="CBCBCB,E9E9E9" bgAlpha="50,50" bgRatio="0,100" bgAngle="270" showBorder="1" borderColor="767575" borderAlpha="50">
<set label="Week 1" value="100" />
<set label="Week 2" value="90" />
<set label="Week 3" value="370" />
<set label="Week 4" value="200" />
</chart>
</linkeddata>
<linkeddata id="2007Mar">
<chart caption="Weekly Sales Summary" subcaption="For March 2007" showLabels="0" showLegend="1" pieSliceDepth="10" enableSmartLabels="0" labelDistance="2"
numberPrefix="$" bgColor="CBCBCB,E9E9E9" bgAlpha="50,50" bgRatio="0,100" bgAngle="270" showBorder="1" borderColor="767575" borderAlpha="50">
<set label="Week 1" value="270" />
<set label="Week 2" value="90" />
<set label="Week 3" value="200" />
<set label="Week 4" value="320" />
</chart>
</linkeddata>
</chart>
</linkeddata>
<linkeddata id="2007Q2">
<chart caption="Monthly Sales Summary" subcaption="For the second quarter of year 2007"
xAxisName="Month" yAxisName="Sales" numberPrefix="$" useRoundEdges="1" >
<set label="April" value="1160" link="newchart-xml-2007Apr" />
<set label="May" value="920" link="newchart-xml-2007May" />
<set label="June" value="620" link="newchart-xml-2007Jun" />
<linkeddata id="2007Apr">
<chart caption="Weekly Sales Summary" subcaption="For April 2007" showLabels="0" showLegend="1" pieSliceDepth="10" enableSmartLabels="0" labelDistance="2"
numberPrefix="$" bgColor="CBCBCB,E9E9E9" bgAlpha="50,50" bgRatio="0,100" bgAngle="270" showBorder="1" borderColor="767575" borderAlpha="50">
<set label="Week 1" value="350" />
<set label="Week 2" value="290" />
<set label="Week 3" value="320" />
<set label="Week 4" value="200" />
</chart>
</linkeddata>
<linkeddata id="2007May">
<chart caption="Weekly Sales Summary" subcaption="For May 2007" showLabels="0" showLegend="1" pieSliceDepth="10" enableSmartLabels="0" labelDistance="2"
numberPrefix="$" bgColor="CBCBCB,E9E9E9" bgAlpha="50,50" bgRatio="0,100" bgAngle="270" showBorder="1" borderColor="767575" borderAlpha="50">
<set label="Week 1" value="80" />
<set label="Week 2" value="290" />
<set label="Week 3" value="400" />
<set label="Week 4" value="150" />
</chart>
</linkeddata>
<linkeddata id="2007Jun">
<chart caption="Weekly Sales Summary" subcaption="For June 2007" showLabels="0" showLegend="1" pieSliceDepth="10" enableSmartLabels="0" labelDistance="2"
numberPrefix="$" bgColor="CBCBCB,E9E9E9" bgAlpha="50,50" bgRatio="0,100" bgAngle="270" showBorder="1" borderColor="767575" borderAlpha="50">
<set label="Week 1" value="210" />
<set label="Week 2" value="90" />
<set label="Week 3" value="200" />
<set label="Week 4" value="120" />
</chart>
</linkeddata>
</chart>
</linkeddata>
<linkeddata id="2007Q3">
<chart caption="Monthly Sales Summary" subcaption="For the third quarter of year 2007"
xAxisName="Month" yAxisName="Sales" numberPrefix="$" useRoundEdges="1" >
<set label="July" value="1140" link="newchart-xml-2007Jul" />
<set label="August" value="860" link="newchart-xml-2007Aug" />
<set label="September" value="1180" link="newchart-xml-2007Sep" />
<linkeddata id="2007Jul">
<chart caption="Weekly Sales Summary" subcaption="For July 2007" showLabels="0" showLegend="1" pieSliceDepth="10" enableSmartLabels="0" labelDistance="2"
numberPrefix="$" bgColor="CBCBCB,E9E9E9" bgAlpha="50,50" bgRatio="0,100" bgAngle="270" showBorder="1" borderColor="767575" borderAlpha="50">
<set label="Week 1" value="400" />
<set label="Week 2" value="290" />
<set label="Week 3" value="150" />
<set label="Week 4" value="300" />
</chart>
</linkeddata>
<linkeddata id="2007Aug">
<chart caption="Weekly Sales Summary" subcaption="For August 2007" showLabels="0" showLegend="1" pieSliceDepth="10" enableSmartLabels="0" labelDistance="2"
numberPrefix="$" bgColor="CBCBCB,E9E9E9" bgAlpha="50,50" bgRatio="0,100" bgAngle="270" showBorder="1" borderColor="767575" borderAlpha="50">
<set label="Week 1" value="310" />
<set label="Week 2" value="250" />
<set label="Week 3" value="100" />
<set label="Week 4" value="200" />
</chart>
</linkeddata>
<linkeddata id="2007Sep">
<chart caption="Weekly Sales Summary" subcaption="For September 2007" showLabels="0" showLegend="1" pieSliceDepth="10" enableSmartLabels="0" labelDistance="2"
numberPrefix="$" bgColor="CBCBCB,E9E9E9" bgAlpha="50,50" bgRatio="0,100" bgAngle="270" showBorder="1" borderColor="767575" borderAlpha="50">
<set label="Week 1" value="370" />
<set label="Week 2" value="290" />
<set label="Week 3" value="200" />
<set label="Week 4" value="320" />
</chart>
</linkeddata>
</chart>
</linkeddata>
<linkeddata id="2007Q4">
<chart caption="Monthly Sales Summary" subcaption="For the fourth quarter of year 2007"
xAxisName="Month" yAxisName="Sales" numberPrefix="$" useRoundEdges="1" >
<set label="October" value="920" link="newchart-xml-2007Oct" />
<set label="November" value="1020" link="newchart-xml-2007Nov" />
<set label="December" value="1050" link="newchart-xml-2007Dec" />
<linkeddata id="2007Oct">
<chart caption="Weekly Sales Summary" subcaption="For October 2007" showLabels="0" showLegend="1" pieSliceDepth="10" enableSmartLabels="0" labelDistance="2"
numberPrefix="$" bgColor="CBCBCB,E9E9E9" bgAlpha="50,50" bgRatio="0,100" bgAngle="270" showBorder="1" borderColor="767575" borderAlpha="50">
<set label="Week 1" value="250" />
<set label="Week 2" value="200" />
<set label="Week 3" value="70" />
<set label="Week 4" value="400" />
</chart>
</linkeddata>
<linkeddata id="2007Nov">
<chart caption="Weekly Sales Summary" subcaption="For November 2007" showLabels="0" showLegend="1" pieSliceDepth="10" enableSmartLabels="0" labelDistance="2"
numberPrefix="$" bgColor="CBCBCB,E9E9E9" bgAlpha="50,50" bgRatio="0,100" bgAngle="270" showBorder="1" borderColor="767575" borderAlpha="50">
<set label="Week 1" value="400" />
<set label="Week 2" value="100" />
<set label="Week 3" value="200" />
<set label="Week 4" value="320" />
</chart>
</linkeddata>
<linkeddata id="2007Dec">
<chart caption="Weekly Sales Summary" subcaption="For December 2007" showLabels="0" showLegend="1" pieSliceDepth="10" enableSmartLabels="0" labelDistance="2"
numberPrefix="$" bgColor="CBCBCB,E9E9E9" bgAlpha="50,50" bgRatio="0,100" bgAngle="270" showBorder="1" borderColor="767575" borderAlpha="50">
<set label="Week 1" value="400" />
<set label="Week 2" value="150" />
<set label="Week 3" value="300" />
<set label="Week 4" value="200" />
</chart>
</linkeddata>
</chart>
</linkeddata>
</chart>
</linkeddata>
</chart>
{
"chart":{
"caption":"Annual Sales Summary", "subcaption":"For the period of 2004 to 2007", "xaxisname":"Year", "yaxisname":"Sales", "numberprefix":"$", "useroundedges":"1"
},
"data":[
{ "label":"2004", "value":"11610", "link":"newchart-json-2004Quarters", "tooltext":"2004, $11.61K{br}click to see details" },
{ "label":"2005", "value":"10430", "link":"newchart-json-2005Quarters", "tooltext":"2005, $10.43K{br}click to see details" },
{ "label":"2006", "value":"10170", "link":"newchart-json-2006Quarters", "tooltext":"2006, $10.17K{br}click to see details" },
{ "label":"2007", "value":"11560", "link":"newchart-json-2007Quarters", "tooltext":"2007, $11.56K{br}click to see details" }
],
"linkeddata":[
{
"id":"2004Quarters",
"linkedchart":{
"chart":{
"caption":"Quarterly Sales Summary", "subcaption":"For the year 2004", "xaxisname":"Quarter", "yaxisname":"Sales", "numberprefix":"$", "useroundedges":"1"
},
"data":[
{ "label":"Q1", "value":"2740", "link":"newchart-json-2004Q1" },
{ "label":"Q2", "value":"2700", "link":"newchart-json-2004Q2" },
{ "label":"Q3", "value":"3180", "link":"newchart-json-2004Q3" },
{ "label":"Q4", "value":"2990", "link":"newchart-json-2004Q4" }
],
"linkeddata":[
{
"id":"2004Q1",
"linkedchart":{
"chart":{
"caption":"Monthly Sales Summary", "subcaption":"For the first quarter of year 2004", "xaxisname":"Month", "yaxisname":"Sales", "numberprefix":"$", "useroundedges":"1" },
"data":[
{ "label":"January", "value":"1100", "link":"newchart-json-2004Jan" },
{ "label":"February", "value":"760", "link":"newchart-json-2004Feb" },
{ "label":"March", "value":"880", "link":"newchart-json-2004Mar" }
],
"linkeddata":[{
"id":"2004Jan",
"linkedchart":{
"chart":{
"caption":"Weekly Sales Summary", "subcaption":"For January 2004", "showlabels":"0", "showlegend":"1",
"pieslicedepth":"10", "enablesmartlabels":"0", "labeldistance":"2", "numberprefix":"$", "bgcolor":"CBCBCB,E9E9E9",
"bgalpha":"50,50", "bgratio":"0,100", "bgangle":"270", "showborder":"1", "bordercolor":"767575", "borderalpha":"50"
},
"data":[
{ "label":"Week 1", "value":"170" },
{ "label":"Week 2", "value":"290" },
{ "label":"Week 3", "value":"320" },
{ "label":"Week 4", "value":"320" }
]
}
},
{
"id":"2004Feb",
"linkedchart":{
"chart":{
"caption":"Weekly Sales Summary","subcaption":"For February 2004", "showlabels":"0", "showlegend":"1",
"pieslicedepth":"10", "enablesmartlabels":"0", "labeldistance":"2", "numberprefix":"$", "bgcolor":"CBCBCB,E9E9E9",
"bgalpha":"50,50", "bgratio":"0,100", "bgangle":"270", "showborder":"1", "bordercolor":"767575", "borderalpha":"50"
},
"data":[
{ "label":"Week 1", "value":"100" },
{ "label":"Week 2", "value":"90" },
{ "label":"Week 3", "value":"370" },
{ "label":"Week 4", "value":"200" }
]
}
},
{
"id":"2004Mar",
"linkedchart":{
"chart":{
"caption":"Weekly Sales Summary",
"subcaption":"For March 2004",
"showlabels":"0",
"showlegend":"1",
"pieslicedepth":"10",
"enablesmartlabels":"0",
"labeldistance":"2",
"numberprefix":"$",
"bgcolor":"CBCBCB,E9E9E9",
"bgalpha":"50,50",
"bgratio":"0,100",
"bgangle":"270",
"showborder":"1",
"bordercolor":"767575",
"borderalpha":"50"
},
"data":[{
"label":"Week 1",
"value":"270"
},
{
"label":"Week 2",
"value":"90"
},
{
"label":"Week 3",
"value":"200"
},
{
"label":"Week 4",
"value":"320"
}
]
}
}
]
}
},
{
"id":"2004Q2",
"linkedchart":{
"chart":{
"caption":"Monthly Sales Summary",
"subcaption":"For the second quarter of year 2004",
"xaxisname":"Month",
"yaxisname":"Sales",
"numberprefix":"$",
"useroundedges":"1"
},
"data":[{
"label":"April",
"value":"1160",
"link":"newchart-json-2004Apr"
},
{
"label":"May",
"value":"920",
"link":"newchart-json-2004May"
},
{
"label":"June",
"value":"620",
"link":"newchart-json-2004Jun"
}
],
"linkeddata":[{
"id":"2004Apr",
"linkedchart":{
"chart":{
"caption":"Weekly Sales Summary",
"subcaption":"For April 2004",
"showlabels":"0",
"showlegend":"1",
"pieslicedepth":"10",
"enablesmartlabels":"0",
"labeldistance":"2",
"numberprefix":"$",
"bgcolor":"CBCBCB,E9E9E9",
"bgalpha":"50,50",
"bgratio":"0,100",
"bgangle":"270",
"showborder":"1",
"bordercolor":"767575",
"borderalpha":"50"
},
"data":[{
"label":"Week 1",
"value":"350"
},
{
"label":"Week 2",
"value":"290"
},
{
"label":"Week 3",
"value":"320"
},
{
"label":"Week 4",
"value":"200"
}
]
}
},
{
"id":"2004May",
"linkedchart":{
"chart":{
"caption":"Weekly Sales Summary",
"subcaption":"For May 2004",
"showlabels":"0",
"showlegend":"1",
"pieslicedepth":"10",
"enablesmartlabels":"0",
"labeldistance":"2",
"numberprefix":"$",
"bgcolor":"CBCBCB,E9E9E9",
"bgalpha":"50,50",
"bgratio":"0,100",
"bgangle":"270",
"showborder":"1",
"bordercolor":"767575",
"borderalpha":"50"
},
"data":[{
"label":"Week 1",
"value":"80"
},
{
"label":"Week 2",
"value":"290"
},
{
"label":"Week 3",
"value":"400"
},
{
"label":"Week 4",
"value":"150"
}
]
}
},
{
"id":"2004Jun",
"linkedchart":{
"chart":{
"caption":"Weekly Sales Summary",
"subcaption":"For June 2004",
"showlabels":"0",
"showlegend":"1",
"pieslicedepth":"10",
"enablesmartlabels":"0",
"labeldistance":"2",
"numberprefix":"$",
"bgcolor":"CBCBCB,E9E9E9",
"bgalpha":"50,50",
"bgratio":"0,100",
"bgangle":"270",
"showborder":"1",
"bordercolor":"767575",
"borderalpha":"50"
},
"data":[{
"label":"Week 1",
"value":"210"
},
{
"label":"Week 2",
"value":"90"
},
{
"label":"Week 3",
"value":"200"
},
{
"label":"Week 4",
"value":"120"
}
]
}
}
]
}
},
{
"id":"2004Q3",
"linkedchart":{
"chart":{
"caption":"Monthly Sales Summary",
"subcaption":"For the third quarter of year 2004",
"xaxisname":"Month",
"yaxisname":"Sales",
"numberprefix":"$",
"useroundedges":"1"
},
"data":[{
"label":"July",
"value":"1140",
"link":"newchart-json-2004Jul"
},
{
"label":"August",
"value":"860",
"link":"newchart-json-2004Aug"
},
{
"label":"September",
"value":"1180",
"link":"newchart-json-2004Sep"
}
],
"linkeddata":[{
"id":"2004Jul",
"linkedchart":{
"chart":{
"caption":"Weekly Sales Summary",
"subcaption":"For July 2004",
"showlabels":"0",
"showlegend":"1",
"pieslicedepth":"10",
"enablesmartlabels":"0",
"labeldistance":"2",
"numberprefix":"$",
"bgcolor":"CBCBCB,E9E9E9",
"bgalpha":"50,50",
"bgratio":"0,100",
"bgangle":"270",
"showborder":"1",
"bordercolor":"767575",
"borderalpha":"50"
},
"data":[{
"label":"Week 1",
"value":"400"
},
{
"label":"Week 2",
"value":"290"
},
{
"label":"Week 3",
"value":"150"
},
{
"label":"Week 4",
"value":"300"
}
]
}
},
{
"id":"2004Aug",
"linkedchart":{
"chart":{
"caption":"Weekly Sales Summary",
"subcaption":"For August 2004",
"showlabels":"0",
"showlegend":"1",
"pieslicedepth":"10",
"enablesmartlabels":"0",
"labeldistance":"2",
"numberprefix":"$",
"bgcolor":"CBCBCB,E9E9E9",
"bgalpha":"50,50",
"bgratio":"0,100",
"bgangle":"270",
"showborder":"1",
"bordercolor":"767575",
"borderalpha":"50"
},
"data":[{
"label":"Week 1",
"value":"310"
},
{
"label":"Week 2",
"value":"250"
},
{
"label":"Week 3",
"value":"100"
},
{
"label":"Week 4",
"value":"200"
}
]
}
},
{
"id":"2004Sep",
"linkedchart":{
"chart":{
"caption":"Weekly Sales Summary",
"subcaption":"For September 2004",
"showlabels":"0",
"showlegend":"1",
"pieslicedepth":"10",
"enablesmartlabels":"0",
"labeldistance":"2",
"numberprefix":"$",
"bgcolor":"CBCBCB,E9E9E9",
"bgalpha":"50,50",
"bgratio":"0,100",
"bgangle":"270",
"showborder":"1",
"bordercolor":"767575",
"borderalpha":"50"
},
"data":[{
"label":"Week 1",
"value":"370"
},
{
"label":"Week 2",
"value":"290"
},
{
"label":"Week 3",
"value":"200"
},
{
"label":"Week 4",
"value":"320"
}
]
}
}
]
}
},
{
"id":"2004Q4",
"linkedchart":{
"chart":{
"caption":"Monthly Sales Summary",
"subcaption":"For the fourth quarter of year 2004",
"xaxisname":"Month",
"yaxisname":"Sales",
"numberprefix":"$",
"useroundedges":"1"
},
"data":[{
"label":"October",
"value":"920",
"link":"newchart-json-2004Oct"
},
{
"label":"November",
"value":"1020",
"link":"newchart-json-2004Nov"
},
{
"label":"December",
"value":"1050",
"link":"newchart-json-2004Dec"
}
],
"linkeddata":[{
"id":"2004Oct",
"linkedchart":{
"chart":{
"caption":"Weekly Sales Summary",
"subcaption":"For October 2004",
"showlabels":"0",
"showlegend":"1",
"pieslicedepth":"10",
"enablesmartlabels":"0",
"labeldistance":"2",
"numberprefix":"$",
"bgcolor":"CBCBCB,E9E9E9",
"bgalpha":"50,50",
"bgratio":"0,100",
"bgangle":"270",
"showborder":"1",
"bordercolor":"767575",
"borderalpha":"50"
},
"data":[{
"label":"Week 1",
"value":"250"
},
{
"label":"Week 2",
"value":"200"
},
{
"label":"Week 3",
"value":"70"
},
{
"label":"Week 4",
"value":"400"
}
]
}
},
{
"id":"2004Nov",
"linkedchart":{
"chart":{
"caption":"Weekly Sales Summary",
"subcaption":"For November 2004",
"showlabels":"0",
"showlegend":"1",
"pieslicedepth":"10",
"enablesmartlabels":"0",
"labeldistance":"2",
"numberprefix":"$",
"bgcolor":"CBCBCB,E9E9E9",
"bgalpha":"50,50",
"bgratio":"0,100",
"bgangle":"270",
"showborder":"1",
"bordercolor":"767575",
"borderalpha":"50"
},
"data":[{
"label":"Week 1",
"value":"400"
},
{
"label":"Week 2",
"value":"100"
},
{
"label":"Week 3",
"value":"200"
},
{
"label":"Week 4",
"value":"320"
}
]
}
},
{
"id":"2004Dec",
"linkedchart":{
"chart":{
"caption":"Weekly Sales Summary",
"subcaption":"For December 2004",
"showlabels":"0",
"showlegend":"1",
"pieslicedepth":"10",
"enablesmartlabels":"0",
"labeldistance":"2",
"numberprefix":"$",
"bgcolor":"CBCBCB,E9E9E9",
"bgalpha":"50,50",
"bgratio":"0,100",
"bgangle":"270",
"showborder":"1",
"bordercolor":"767575",
"borderalpha":"50"
},
"data":[{
"label":"Week 1",
"value":"400"
},
{
"label":"Week 2",
"value":"150"
},
{
"label":"Week 3",
"value":"300"
},
{
"label":"Week 4",
"value":"200"
}
]
}
}
]
}
}
]
}
},
{
"id":"2005Quarters",
"linkedchart":{
"chart":{
"caption":"Quarterly Sales Summary",
"subcaption":"For the year 2005",
"xaxisname":"Quarter",
"yaxisname":"Sales",
"numberprefix":"$",
"useroundedges":"1"
},
"data":[{
"label":"Q1",
"value":"3060",
"link":"newchart-json-2005Q1"
},
{
"label":"Q2",
"value":"2030",
"link":"newchart-json-2005Q2"
},
{
"label":"Q3",
"value":"2700",
"link":"newchart-json-2005Q3"
},
{
"label":"Q4",
"value":"2640",
"link":"newchart-json-2005Q4"
}
],
"linkeddata":[{
"id":"2005Q1",
"linkedchart":{
"chart":{
"caption":"Monthly Sales Summary",
"subcaption":"For the first quarter of year 2005",
"xaxisname":"Month",
"yaxisname":"Sales",
"numberprefix":"$",
"useroundedges":"1"
},
"data":[{
"label":"January",
"value":"3700",
"link":"newchart-json-2004Jan"
},
{
"label":"February",
"value":"2900",
"link":"newchart-json-2004Feb"
},
{
"label":"March",
"value":"3200",
"link":"newchart-json-2004Mar"
}
],
"linkeddata":[{
"id":"2005Jan",
"linkedchart":{
"chart":{
"caption":"Weekly Sales Summary",
"subcaption":"For January 2005",
"showlabels":"0",
"showlegend":"1",
"pieslicedepth":"10",
"enablesmartlabels":"0",
"labeldistance":"2",
"numberprefix":"$",
"bgcolor":"CBCBCB,E9E9E9",
"bgalpha":"50,50",
"bgratio":"0,100",
"bgangle":"270",
"showborder":"1",
"bordercolor":"767575",
"borderalpha":"50"
},
"data":[{
"label":"Week 1",
"value":"450"
},
{
"label":"Week 2",
"value":"290"
},
{
"label":"Week 3",
"value":"380"
},
{
"label":"Week 4",
"value":"320"
}
]
}
},
{
"id":"2005Feb",
"linkedchart":{
"chart":{
"caption":"Weekly Sales Summary",
"subcaption":"For February 2005",
"showlabels":"0",
"showlegend":"1",
"pieslicedepth":"10",
"enablesmartlabels":"0",
"labeldistance":"2",
"numberprefix":"$",
"bgcolor":"CBCBCB,E9E9E9",
"bgalpha":"50,50",
"bgratio":"0,100",
"bgangle":"270",
"showborder":"1",
"bordercolor":"767575",
"borderalpha":"50"
},
"data":[{
"label":"Week 1",
"value":"100"
},
{
"label":"Week 2",
"value":"200"
},
{
"label":"Week 3",
"value":"100"
},
{
"label":"Week 4",
"value":"320"
}
]
}
},
{
"id":"2005Mar",
"linkedchart":{
"chart":{
"caption":"Weekly Sales Summary",
"subcaption":"For March 2005",
"showlabels":"0",
"showlegend":"1",
"pieslicedepth":"10",
"enablesmartlabels":"0",
"labeldistance":"2",
"numberprefix":"$",
"bgcolor":"CBCBCB,E9E9E9",
"bgalpha":"50,50",
"bgratio":"0,100",
"bgangle":"270",
"showborder":"1",
"bordercolor":"767575",
"borderalpha":"50"
},
"data":[{
"label":"Week 1",
"value":"120"
},
{
"label":"Week 2",
"value":"280"
},
{
"label":"Week 3",
"value":"300"
},
{
"label":"Week 4",
"value":"200"
}
]
}
}
]
}
},
{
"id":"2005Q2",
"linkedchart":{
"chart":{
"caption":"Monthly Sales Summary",
"subcaption":"For the second quarter of year 2005",
"xaxisname":"Month",
"yaxisname":"Sales",
"numberprefix":"$",
"useroundedges":"1"
},
"data":[{
"label":"April",
"value":"3700",
"link":"newchart-json-2005Apr"
},
{
"label":"May",
"value":"2900",
"link":"newchart-json-2005May"
},
{
"label":"June",
"value":"3200",
"link":"newchart-json-2005Jun"
}
],
"linkeddata":[{
"id":"2005Apr",
"linkedchart":{
"chart":{
"caption":"Weekly Sales Summary",
"subcaption":"For April 2005",
"showlabels":"0",
"showlegend":"1",
"pieslicedepth":"10",
"enablesmartlabels":"0",
"labeldistance":"2",
"numberprefix":"$",
"bgcolor":"CBCBCB,E9E9E9",
"bgalpha":"50,50",
"bgratio":"0,100",
"bgangle":"270",
"showborder":"1",
"bordercolor":"767575",
"borderalpha":"50"
},
"data":[{
"label":"Week 1",
"value":"170"
},
{
"label":"Week 2",
"value":"200"
},
{
"label":"Week 3",
"value":"80"
},
{
"label":"Week 4",
"value":"300"
}
]
}
},
{
"id":"2005May",
"linkedchart":{
"chart":{
"caption":"Weekly Sales Summary",
"subcaption":"For May 2005",
"showlabels":"0",
"showlegend":"1",
"pieslicedepth":"10",
"enablesmartlabels":"0",
"labeldistance":"2",
"numberprefix":"$",
"bgcolor":"CBCBCB,E9E9E9",
"bgalpha":"50,50",
"bgratio":"0,100",
"bgangle":"270",
"showborder":"1",
"bordercolor":"767575",
"borderalpha":"50"
},
"data":[{
"label":"Week 1",
"value":"100"
},
{
"label":"Week 2",
"value":"200"
},
{
"label":"Week 3",
"value":"300"
},
{
"label":"Week 4",
"value":"80"
}
]
}
},
{
"id":"2005Jun",
"linkedchart":{
"chart":{
"caption":"Weekly Sales Summary",
"subcaption":"For June 2005",
"showlabels":"0",
"showlegend":"1",
"pieslicedepth":"10",
"enablesmartlabels":"0",
"labeldistance":"2",
"numberprefix":"$",
"bgcolor":"CBCBCB,E9E9E9",
"bgalpha":"50,50",
"bgratio":"0,100",
"bgangle":"270",
"showborder":"1",
"bordercolor":"767575",
"borderalpha":"50"
},
"data":[{
"label":"Week 1",
"value":"150"
},
{
"label":"Week 2",
"value":"50"
},
{
"label":"Week 3",
"value":"100"
},
{
"label":"Week 4",
"value":"300"
}
]
}
}
]
}
},
{
"id":"2005Q3",
"linkedchart":{
"chart":{
"caption":"Monthly Sales Summary",
"subcaption":"For the third quarter of year 2005",
"xaxisname":"Month",
"yaxisname":"Sales",
"numberprefix":"$",
"useroundedges":"1"
},
"data":[{
"label":"July",
"value":"3700",
"link":"newchart-json-2005Jul"
},
{
"label":"August",
"value":"2900",
"link":"newchart-json-2005Aug"
},
{
"label":"September",
"value":"3200",
"link":"newchart-json-2005Sep"
}
],
"linkeddata":[{
"id":"2005Jul",
"linkedchart":{
"chart":{
"caption":"Weekly Sales Summary",
"subcaption":"For July 2005",
"showlabels":"0",
"showlegend":"1",
"pieslicedepth":"10",
"enablesmartlabels":"0",
"labeldistance":"2",
"numberprefix":"$",
"bgcolor":"CBCBCB,E9E9E9",
"bgalpha":"50,50",
"bgratio":"0,100",
"bgangle":"270",
"showborder":"1",
"bordercolor":"767575",
"borderalpha":"50"
},
"data":[{
"label":"Week 1",
"value":"100"
},
{
"label":"Week 2",
"value":"230"
},
{
"label":"Week 3",
"value":"200"
},
{
"label":"Week 4",
"value":"120"
}
]
}
},
{
"id":"2005Aug",
"linkedchart":{
"chart":{
"caption":"Weekly Sales Summary",
"subcaption":"For August 2005",
"showlabels":"0",
"showlegend":"1",
"pieslicedepth":"10",
"enablesmartlabels":"0",
"labeldistance":"2",
"numberprefix":"$",
"bgcolor":"CBCBCB,E9E9E9",
"bgalpha":"50,50",
"bgratio":"0,100",
"bgangle":"270",
"showborder":"1",
"bordercolor":"767575",
"borderalpha":"50"
},
"data":[{
"label":"Week 1",
"value":"300"
},
{
"label":"Week 2",
"value":"290"
},
{
"label":"Week 3",
"value":"220"
},
{
"label":"Week 4",
"value":"100"
}
]
}
},
{
"id":"2005Sep",
"linkedchart":{
"chart":{
"caption":"Weekly Sales Summary",
"subcaption":"For September 2005",
"showlabels":"0",
"showlegend":"1",
"pieslicedepth":"10",
"enablesmartlabels":"0",
"labeldistance":"2",
"numberprefix":"$",
"bgcolor":"CBCBCB,E9E9E9",
"bgalpha":"50,50",
"bgratio":"0,100",
"bgangle":"270",
"showborder":"1",
"bordercolor":"767575",
"borderalpha":"50"
},
"data":[{
"label":"Week 1",
"value":"300"
},
{
"label":"Week 2",
"value":"190"
},
{
"label":"Week 3",
"value":"350"
},
{
"label":"Week 4",
"value":"400"
}
]
}
}
]
}
},
{
"id":"2005Q4",
"linkedchart":{
"chart":{
"caption":"Monthly Sales Summary",
"subcaption":"For the fourth quarter of year 2005",
"xaxisname":"Month",
"yaxisname":"Sales",
"numberprefix":"$",
"useroundedges":"1"
},
"data":[{
"label":"October",
"value":"3700",
"link":"newchart-json-2005Oct"
},
{
"label":"November",
"value":"2900",
"link":"newchart-json-2005Nov"
},
{
"label":"December",
"value":"3200",
"link":"newchart-json-2005Dec"
}
],
"linkeddata":[{
"id":"2005Oct",
"linkedchart":{
"chart":{
"caption":"Weekly Sales Summary",
"subcaption":"For October 2005",
"showlabels":"0",
"showlegend":"1",
"pieslicedepth":"10",
"enablesmartlabels":"0",
"labeldistance":"2",
"numberprefix":"$",
"bgcolor":"CBCBCB,E9E9E9",
"bgalpha":"50,50",
"bgratio":"0,100",
"bgangle":"270",
"showborder":"1",
"bordercolor":"767575",
"borderalpha":"50"
},
"data":[{
"label":"Week 1",
"value":"110"
},
{
"label":"Week 2",
"value":"190"
},
{
"label":"Week 3",
"value":"400"
},
{
"label":"Week 4",
"value":"200"
}
]
}
},
{
"id":"2005Nov",
"linkedchart":{
"chart":{
"caption":"Weekly Sales Summary",
"subcaption":"For November 2005",
"showlabels":"0",
"showlegend":"1",
"pieslicedepth":"10",
"enablesmartlabels":"0",
"labeldistance":"2",
"numberprefix":"$",
"bgcolor":"CBCBCB,E9E9E9",
"bgalpha":"50,50",
"bgratio":"0,100",
"bgangle":"270",
"showborder":"1",
"bordercolor":"767575",
"borderalpha":"50"
},
"data":[{
"label":"Week 1",
"value":"200"
},
{
"label":"Week 2",
"value":"260"
},
{
"label":"Week 3",
"value":"120"
},
{
"label":"Week 4",
"value":"250"
}
]
}
},
{
"id":"2005Dec",
"linkedchart":{
"chart":{
"caption":"Weekly Sales Summary",
"subcaption":"For December 2005",
"showlabels":"0",
"showlegend":"1",
"pieslicedepth":"10",
"enablesmartlabels":"0",
"labeldistance":"2",
"numberprefix":"$",
"bgcolor":"CBCBCB,E9E9E9",
"bgalpha":"50,50",
"bgratio":"0,100",
"bgangle":"270",
"showborder":"1",
"bordercolor":"767575",
"borderalpha":"50"
},
"data":[{
"label":"Week 1",
"value":"300"
},
{
"label":"Week 2",
"value":"290"
},
{
"label":"Week 3",
"value":"200"
},
{
"label":"Week 4",
"value":"120"
}
]
}
}
]
}
}
]
}
},
{
"id":"2006Quarters",
"linkedchart":{
"chart":{
"caption":"Quarterly Sales Summary",
"subcaption":"For the year 2006",
"xaxisname":"Quarter",
"yaxisname":"Sales",
"numberprefix":"$",
"useroundedges":"1"
},
"data":[{
"label":"Q1",
"value":"2410",
"link":"newchart-json-2006Q1"
},
{
"label":"Q2",
"value":"2800",
"link":"newchart-json-2006Q2"
},
{
"label":"Q3",
"value":"2550",
"link":"newchart-json-2006Q3"
},
{
"label":"Q4",
"value":"2410",
"link":"newchart-json-2006Q4"
}
],
"linkeddata":[{
"id":"2006Q1",
"linkedchart":{
"chart":{
"caption":"Monthly Sales Summary",
"subcaption":"For the first quarter of year 2006",
"xaxisname":"Month",
"yaxisname":"Sales",
"numberprefix":"$",
"useroundedges":"1"
},
"data":[{
"label":"January",
"value":"870",
"link":"newchart-json-2006Jan"
},
{
"label":"February",
"value":"890",
"link":"newchart-json-2006Feb"
},
{
"label":"March",
"value":"650",
"link":"newchart-json-2006Mar"
}
],
"linkeddata":[{
"id":"2006Jan",
"linkedchart":{
"chart":{
"caption":"Weekly Sales Summary",
"subcaption":"For January 2006",
"showlabels":"0",
"showlegend":"1",
"pieslicedepth":"10",
"enablesmartlabels":"0",
"labeldistance":"2",
"numberprefix":"$",
"bgcolor":"CBCBCB,E9E9E9",
"bgalpha":"50,50",
"bgratio":"0,100",
"bgangle":"270",
"showborder":"1",
"bordercolor":"767575",
"borderalpha":"50"
},
"data":[{
"label":"Week 1",
"value":"370"
},
{
"label":"Week 2",
"value":"200"
},
{
"label":"Week 3",
"value":"100"
},
{
"label":"Week 4",
"value":"200"
}
]
}
},
{
"id":"2006Feb",
"linkedchart":{
"chart":{
"caption":"Weekly Sales Summary",
"subcaption":"For February 2006",
"showlabels":"0",
"showlegend":"1",
"pieslicedepth":"10",
"enablesmartlabels":"0",
"labeldistance":"2",
"numberprefix":"$",
"bgcolor":"CBCBCB,E9E9E9",
"bgalpha":"50,50",
"bgratio":"0,100",
"bgangle":"270",
"showborder":"1",
"bordercolor":"767575",
"borderalpha":"50"
},
"data":[{
"label":"Week 1",
"value":"100"
},
{
"label":"Week 2",
"value":"390"
},
{
"label":"Week 3",
"value":"200"
},
{
"label":"Week 4",
"value":"200"
}
]
}
},
{
"id":"2006Mar",
"linkedchart":{
"chart":{
"caption":"Weekly Sales Summary",
"subcaption":"For March 2006",
"showlabels":"0",
"showlegend":"1",
"pieslicedepth":"10",
"enablesmartlabels":"0",
"labeldistance":"2",
"numberprefix":"$",
"bgcolor":"CBCBCB,E9E9E9",
"bgalpha":"50,50",
"bgratio":"0,100",
"bgangle":"270",
"showborder":"1",
"bordercolor":"767575",
"borderalpha":"50"
},
"data":[{
"label":"Week 1",
"value":"80"
},
{
"label":"Week 2",
"value":"250"
},
{
"label":"Week 3",
"value":"200"
},
{
"label":"Week 4",
"value":"120"
}
]
}
}
]
}
},
{
"id":"2006Q2",
"linkedchart":{
"chart":{
"caption":"Monthly Sales Summary",
"subcaption":"For the second quarter of year 2006",
"xaxisname":"Month",
"yaxisname":"Sales",
"numberprefix":"$",
"useroundedges":"1"
},
"data":[{
"label":"April",
"value":"1300",
"link":"newchart-json-2006Apr"
},
{
"label":"May",
"value":"440",
"link":"newchart-json-2006May"
},
{
"label":"June",
"value":"1060",
"link":"newchart-json-2006Jun"
}
],
"linkeddata":[{
"id":"2006Apr",
"linkedchart":{
"chart":{
"caption":"Weekly Sales Summary",
"subcaption":"For April 2006",
"showlabels":"0",
"showlegend":"1",
"pieslicedepth":"10",
"enablesmartlabels":"0",
"labeldistance":"2",
"numberprefix":"$",
"bgcolor":"CBCBCB,E9E9E9",
"bgalpha":"50,50",
"bgratio":"0,100",
"bgangle":"270",
"showborder":"1",
"bordercolor":"767575",
"borderalpha":"50"
},
"data":[{
"label":"Week 1",
"value":"370"
},
{
"label":"Week 2",
"value":"290"
},
{
"label":"Week 3",
"value":"320"
},
{
"label":"Week 4",
"value":"320"
}
]
}
},
{
"id":"2006May",
"linkedchart":{
"chart":{
"caption":"Weekly Sales Summary",
"subcaption":"For May 2006",
"showlabels":"0",
"showlegend":"1",
"pieslicedepth":"10",
"enablesmartlabels":"0",
"labeldistance":"2",
"numberprefix":"$",
"bgcolor":"CBCBCB,E9E9E9",
"bgalpha":"50,50",
"bgratio":"0,100",
"bgangle":"270",
"showborder":"1",
"bordercolor":"767575",
"borderalpha":"50"
},
"data":[{
"label":"Week 1",
"value":"90"
},
{
"label":"Week 2",
"value":"100"
},
{
"label":"Week 3",
"value":"200"
},
{
"label":"Week 4",
"value":"50"
}
]
}
},
{
"id":"2006Jun",
"linkedchart":{
"chart":{
"caption":"Weekly Sales Summary",
"subcaption":"For June 2006",
"showlabels":"0",
"showlegend":"1",
"pieslicedepth":"10",
"enablesmartlabels":"0",
"labeldistance":"2",
"numberprefix":"$",
"bgcolor":"CBCBCB,E9E9E9",
"bgalpha":"50,50",
"bgratio":"0,100",
"bgangle":"270",
"showborder":"1",
"bordercolor":"767575",
"borderalpha":"50"
},
"data":[{
"label":"Week 1",
"value":"370"
},
{
"label":"Week 2",
"value":"290"
},
{
"label":"Week 3",
"value":"300"
},
{
"label":"Week 4",
"value":"100"
}
]
}
}
]
}
},
{
"id":"2006Q3",
"linkedchart":{
"chart":{
"caption":"Monthly Sales Summary",
"subcaption":"For the third quarter of year 2006",
"xaxisname":"Month",
"yaxisname":"Sales",
"numberprefix":"$",
"useroundedges":"1"
},
"data":[{
"label":"July",
"value":"850",
"link":"newchart-json-2006Jul"
},
{
"label":"August",
"value":"1030",
"link":"newchart-json-2006Aug"
},
{
"label":"September",
"value":"670",
"link":"newchart-json-2006Sep"
}
],
"linkeddata":[{
"id":"2006Jul",
"linkedchart":{
"chart":{
"caption":"Weekly Sales Summary",
"subcaption":"For July 2006",
"showlabels":"0",
"showlegend":"1",
"pieslicedepth":"10",
"enablesmartlabels":"0",
"labeldistance":"2",
"numberprefix":"$",
"bgcolor":"CBCBCB,E9E9E9",
"bgalpha":"50,50",
"bgratio":"0,100",
"bgangle":"270",
"showborder":"1",
"bordercolor":"767575",
"borderalpha":"50"
},
"data":[{
"label":"Week 1",
"value":"200"
},
{
"label":"Week 2",
"value":"100"
},
{
"label":"Week 3",
"value":"250"
},
{
"label":"Week 4",
"value":"300"
}
]
}
},
{
"id":"2006Aug",
"linkedchart":{
"chart":{
"caption":"Weekly Sales Summary",
"subcaption":"For August 2006",
"showlabels":"0",
"showlegend":"1",
"pieslicedepth":"10",
"enablesmartlabels":"0",
"labeldistance":"2",
"numberprefix":"$",
"bgcolor":"CBCBCB,E9E9E9",
"bgalpha":"50,50",
"bgratio":"0,100",
"bgangle":"270",
"showborder":"1",
"bordercolor":"767575",
"borderalpha":"50"
},
"data":[{
"label":"Week 1",
"value":"370"
},
{
"label":"Week 2",
"value":"90"
},
{
"label":"Week 3",
"value":"400"
},
{
"label":"Week 4",
"value":"170"
}
]
}
},
{
"id":"2006Sep",
"linkedchart":{
"chart":{
"caption":"Weekly Sales Summary",
"subcaption":"For September 2006",
"showlabels":"0",
"showlegend":"1",
"pieslicedepth":"10",
"enablesmartlabels":"0",
"labeldistance":"2",
"numberprefix":"$",
"bgcolor":"CBCBCB,E9E9E9",
"bgalpha":"50,50",
"bgratio":"0,100",
"bgangle":"270",
"showborder":"1",
"bordercolor":"767575",
"borderalpha":"50"
},
"data":[{
"label":"Week 1",
"value":"100"
},
{
"label":"Week 2",
"value":"290"
},
{
"label":"Week 3",
"value":"80"
},
{
"label":"Week 4",
"value":"200"
}
]
}
}
]
}
},
{
"id":"2006Q4",
"linkedchart":{
"chart":{
"caption":"Monthly Sales Summary",
"subcaption":"For the fourth quarter of year 2006",
"xaxisname":"Month",
"yaxisname":"Sales",
"numberprefix":"$",
"useroundedges":"1"
},
"data":[{
"label":"October",
"value":"590",
"link":"newchart-json-2006Oct"
},
{
"label":"November",
"value":"690",
"link":"newchart-json-2006Nov"
},
{
"label":"December",
"value":"1130",
"link":"newchart-json-2006Dec"
}
],
"linkeddata":[{
"id":"2006Oct",
"linkedchart":{
"chart":{
"caption":"Weekly Sales Summary",
"subcaption":"For October 2006",
"showlabels":"0",
"showlegend":"1",
"pieslicedepth":"10",
"enablesmartlabels":"0",
"labeldistance":"2",
"numberprefix":"$",
"bgcolor":"CBCBCB,E9E9E9",
"bgalpha":"50,50",
"bgratio":"0,100",
"bgangle":"270",
"showborder":"1",
"bordercolor":"767575",
"borderalpha":"50"
},
"data":[{
"label":"Week 1",
"value":"100"
},
{
"label":"Week 2",
"value":"120"
},
{
"label":"Week 3",
"value":"300"
},
{
"label":"Week 4",
"value":"70"
}
]
}
},
{
"id":"2006Nov",
"linkedchart":{
"chart":{
"caption":"Weekly Sales Summary",
"subcaption":"For November 2006",
"showlabels":"0",
"showlegend":"1",
"pieslicedepth":"10",
"enablesmartlabels":"0",
"labeldistance":"2",
"numberprefix":"$",
"bgcolor":"CBCBCB,E9E9E9",
"bgalpha":"50,50",
"bgratio":"0,100",
"bgangle":"270",
"showborder":"1",
"bordercolor":"767575",
"borderalpha":"50"
},
"data":[{
"label":"Week 1",
"value":"200"
},
{
"label":"Week 2",
"value":"90"
},
{
"label":"Week 3",
"value":"300"
},
{
"label":"Week 4",
"value":"100"
}
]
}
},
{
"id":"2006Dec",
"linkedchart":{
"chart":{
"caption":"Weekly Sales Summary",
"subcaption":"For December 2006",
"showlabels":"0",
"showlegend":"1",
"pieslicedepth":"10",
"enablesmartlabels":"0",
"labeldistance":"2",
"numberprefix":"$",
"bgcolor":"CBCBCB,E9E9E9",
"bgalpha":"50,50",
"bgratio":"0,100",
"bgangle":"270",
"showborder":"1",
"bordercolor":"767575",
"borderalpha":"50"
},
"data":[{
"label":"Week 1",
"value":"320"
},
{
"label":"Week 2",
"value":"290"
},
{
"label":"Week 3",
"value":"320"
},
{
"label":"Week 4",
"value":"200"
}
]
}
}
]
}
}
]
}
},
{
"id":"2007Quarters",
"linkedchart":{
"chart":{
"caption":"Quarterly Sales Summary",
"subcaption":"For the year 2007",
"xaxisname":"Quarter",
"yaxisname":"Sales",
"numberprefix":"$",
"useroundedges":"1"
},
"data":[{
"label":"Q1",
"value":"2690",
"link":"newchart-json-2007Q1"
},
{
"label":"Q2",
"value":"2700",
"link":"newchart-json-2007Q2"
},
{
"label":"Q3",
"value":"3180",
"link":"newchart-json-2007Q3"
},
{
"label":"Q4",
"value":"2990",
"link":"newchart-json-2007Q4"
}
],
"linkeddata":[{
"id":"2007Q1",
"linkedchart":{
"chart":{
"caption":"Monthly Sales Summary",
"subcaption":"For the first quarter of year 2007",
"xaxisname":"Month",
"yaxisname":"Sales",
"numberprefix":"$",
"useroundedges":"1"
},
"data":[{
"label":"January",
"value":"1050",
"link":"newchart-json-2007Jan"
},
{
"label":"February",
"value":"760",
"link":"newchart-json-2007Feb"
},
{
"label":"March",
"value":"880",
"link":"newchart-json-2007Mar"
}
],
"linkeddata":[{
"id":"2007Jan",
"linkedchart":{
"chart":{
"caption":"Weekly Sales Summary",
"subcaption":"For January 2007",
"showlabels":"0",
"showlegend":"1",
"pieslicedepth":"10",
"enablesmartlabels":"0",
"labeldistance":"2",
"numberprefix":"$",
"bgcolor":"CBCBCB,E9E9E9",
"bgalpha":"50,50",
"bgratio":"0,100",
"bgangle":"270",
"showborder":"1",
"bordercolor":"767575",
"borderalpha":"50"
},
"data":[{
"label":"Week 1",
"value":"120"
},
{
"label":"Week 2",
"value":"290"
},
{
"label":"Week 3",
"value":"320"
},
{
"label":"Week 4",
"value":"320"
}
]
}
},
{
"id":"2007Feb",
"linkedchart":{
"chart":{
"caption":"Weekly Sales Summary",
"subcaption":"For February 2007",
"showlabels":"0",
"showlegend":"1",
"pieslicedepth":"10",
"enablesmartlabels":"0",
"labeldistance":"2",
"numberprefix":"$",
"bgcolor":"CBCBCB,E9E9E9",
"bgalpha":"50,50",
"bgratio":"0,100",
"bgangle":"270",
"showborder":"1",
"bordercolor":"767575",
"borderalpha":"50"
},
"data":[{
"label":"Week 1",
"value":"100"
},
{
"label":"Week 2",
"value":"90"
},
{
"label":"Week 3",
"value":"370"
},
{
"label":"Week 4",
"value":"200"
}
]
}
},
{
"id":"2007Mar",
"linkedchart":{
"chart":{
"caption":"Weekly Sales Summary",
"subcaption":"For March 2007",
"showlabels":"0",
"showlegend":"1",
"pieslicedepth":"10",
"enablesmartlabels":"0",
"labeldistance":"2",
"numberprefix":"$",
"bgcolor":"CBCBCB,E9E9E9",
"bgalpha":"50,50",
"bgratio":"0,100",
"bgangle":"270",
"showborder":"1",
"bordercolor":"767575",
"borderalpha":"50"
},
"data":[{
"label":"Week 1",
"value":"270"
},
{
"label":"Week 2",
"value":"90"
},
{
"label":"Week 3",
"value":"200"
},
{
"label":"Week 4",
"value":"320"
}
]
}
}
]
}
},
{
"id":"2007Q2",
"linkedchart":{
"chart":{
"caption":"Monthly Sales Summary",
"subcaption":"For the second quarter of year 2007",
"xaxisname":"Month",
"yaxisname":"Sales",
"numberprefix":"$",
"useroundedges":"1"
},
"data":[{
"label":"April",
"value":"1160",
"link":"newchart-json-2007Apr"
},
{
"label":"May",
"value":"920",
"link":"newchart-json-2007May"
},
{
"label":"June",
"value":"620",
"link":"newchart-json-2007Jun"
}
],
"linkeddata":[{
"id":"2007Apr",
"linkedchart":{
"chart":{
"caption":"Weekly Sales Summary",
"subcaption":"For April 2007",
"showlabels":"0",
"showlegend":"1",
"pieslicedepth":"10",
"enablesmartlabels":"0",
"labeldistance":"2",
"numberprefix":"$",
"bgcolor":"CBCBCB,E9E9E9",
"bgalpha":"50,50",
"bgratio":"0,100",
"bgangle":"270",
"showborder":"1",
"bordercolor":"767575",
"borderalpha":"50"
},
"data":[{
"label":"Week 1",
"value":"350"
},
{
"label":"Week 2",
"value":"290"
},
{
"label":"Week 3",
"value":"320"
},
{
"label":"Week 4",
"value":"200"
}
]
}
},
{
"id":"2007May",
"linkedchart":{
"chart":{
"caption":"Weekly Sales Summary",
"subcaption":"For May 2007",
"showlabels":"0",
"showlegend":"1",
"pieslicedepth":"10",
"enablesmartlabels":"0",
"labeldistance":"2",
"numberprefix":"$",
"bgcolor":"CBCBCB,E9E9E9",
"bgalpha":"50,50",
"bgratio":"0,100",
"bgangle":"270",
"showborder":"1",
"bordercolor":"767575",
"borderalpha":"50"
},
"data":[{
"label":"Week 1",
"value":"80"
},
{
"label":"Week 2",
"value":"290"
},
{
"label":"Week 3",
"value":"400"
},
{
"label":"Week 4",
"value":"150"
}
]
}
},
{
"id":"2007Jun",
"linkedchart":{
"chart":{
"caption":"Weekly Sales Summary",
"subcaption":"For June 2007",
"showlabels":"0",
"showlegend":"1",
"pieslicedepth":"10",
"enablesmartlabels":"0",
"labeldistance":"2",
"numberprefix":"$",
"bgcolor":"CBCBCB,E9E9E9",
"bgalpha":"50,50",
"bgratio":"0,100",
"bgangle":"270",
"showborder":"1",
"bordercolor":"767575",
"borderalpha":"50"
},
"data":[{
"label":"Week 1",
"value":"210"
},
{
"label":"Week 2",
"value":"90"
},
{
"label":"Week 3",
"value":"200"
},
{
"label":"Week 4",
"value":"120"
}
]
}
}
]
}
},
{
"id":"2007Q3",
"linkedchart":{
"chart":{
"caption":"Monthly Sales Summary",
"subcaption":"For the third quarter of year 2007",
"xaxisname":"Month",
"yaxisname":"Sales",
"numberprefix":"$",
"useroundedges":"1"
},
"data":[{
"label":"July",
"value":"1140",
"link":"newchart-json-2007Jul"
},
{
"label":"August",
"value":"860",
"link":"newchart-json-2007Aug"
},
{
"label":"September",
"value":"1180",
"link":"newchart-json-2007Sep"
}
],
"linkeddata":[{
"id":"2007Jul",
"linkedchart":{
"chart":{
"caption":"Weekly Sales Summary",
"subcaption":"For July 2007",
"showlabels":"0",
"showlegend":"1",
"pieslicedepth":"10",
"enablesmartlabels":"0",
"labeldistance":"2",
"numberprefix":"$",
"bgcolor":"CBCBCB,E9E9E9",
"bgalpha":"50,50",
"bgratio":"0,100",
"bgangle":"270",
"showborder":"1",
"bordercolor":"767575",
"borderalpha":"50"
},
"data":[{
"label":"Week 1",
"value":"400"
},
{
"label":"Week 2",
"value":"290"
},
{
"label":"Week 3",
"value":"150"
},
{
"label":"Week 4",
"value":"300"
}
]
}
},
{
"id":"2007Aug",
"linkedchart":{
"chart":{
"caption":"Weekly Sales Summary",
"subcaption":"For August 2007",
"showlabels":"0",
"showlegend":"1",
"pieslicedepth":"10",
"enablesmartlabels":"0",
"labeldistance":"2",
"numberprefix":"$",
"bgcolor":"CBCBCB,E9E9E9",
"bgalpha":"50,50",
"bgratio":"0,100",
"bgangle":"270",
"showborder":"1",
"bordercolor":"767575",
"borderalpha":"50"
},
"data":[{
"label":"Week 1",
"value":"310"
},
{
"label":"Week 2",
"value":"250"
},
{
"label":"Week 3",
"value":"100"
},
{
"label":"Week 4",
"value":"200"
}
]
}
},
{
"id":"2007Sep",
"linkedchart":{
"chart":{
"caption":"Weekly Sales Summary",
"subcaption":"For September 2007",
"showlabels":"0",
"showlegend":"1",
"pieslicedepth":"10",
"enablesmartlabels":"0",
"labeldistance":"2",
"numberprefix":"$",
"bgcolor":"CBCBCB,E9E9E9",
"bgalpha":"50,50",
"bgratio":"0,100",
"bgangle":"270",
"showborder":"1",
"bordercolor":"767575",
"borderalpha":"50"
},
"data":[{
"label":"Week 1",
"value":"370"
},
{
"label":"Week 2",
"value":"290"
},
{
"label":"Week 3",
"value":"200"
},
{
"label":"Week 4",
"value":"320"
}
]
}
}
]
}
},
{
"id":"2007Q4",
"linkedchart":{
"chart":{
"caption":"Monthly Sales Summary",
"subcaption":"For the fourth quarter of year 2007",
"xaxisname":"Month",
"yaxisname":"Sales",
"numberprefix":"$",
"useroundedges":"1"
},
"data":[{
"label":"October",
"value":"920",
"link":"newchart-json-2007Oct"
},
{
"label":"November",
"value":"1020",
"link":"newchart-json-2007Nov"
},
{
"label":"December",
"value":"1050",
"link":"newchart-json-2007Dec"
}
],
"linkeddata":[{
"id":"2007Oct",
"linkedchart":{
"chart":{
"caption":"Weekly Sales Summary",
"subcaption":"For October 2007",
"showlabels":"0",
"showlegend":"1",
"pieslicedepth":"10",
"enablesmartlabels":"0",
"labeldistance":"2",
"numberprefix":"$",
"bgcolor":"CBCBCB,E9E9E9",
"bgalpha":"50,50",
"bgratio":"0,100",
"bgangle":"270",
"showborder":"1",
"bordercolor":"767575",
"borderalpha":"50"
},
"data":[{
"label":"Week 1",
"value":"250"
},
{
"label":"Week 2",
"value":"200"
},
{
"label":"Week 3",
"value":"70"
},
{
"label":"Week 4",
"value":"400"
}
]
}
},
{
"id":"2007Nov",
"linkedchart":{
"chart":{
"caption":"Weekly Sales Summary",
"subcaption":"For November 2007",
"showlabels":"0",
"showlegend":"1",
"pieslicedepth":"10",
"enablesmartlabels":"0",
"labeldistance":"2",
"numberprefix":"$",
"bgcolor":"CBCBCB,E9E9E9",
"bgalpha":"50,50",
"bgratio":"0,100",
"bgangle":"270",
"showborder":"1",
"bordercolor":"767575",
"borderalpha":"50"
},
"data":[{
"label":"Week 1",
"value":"400"
},
{
"label":"Week 2",
"value":"100"
},
{
"label":"Week 3",
"value":"200"
},
{
"label":"Week 4",
"value":"320"
}
]
}
},
{
"id":"2007Dec",
"linkedchart":{
"chart":{
"caption":"Weekly Sales Summary",
"subcaption":"For December 2007",
"showlabels":"0",
"showlegend":"1",
"pieslicedepth":"10",
"enablesmartlabels":"0",
"labeldistance":"2",
"numberprefix":"$",
"bgcolor":"CBCBCB,E9E9E9",
"bgalpha":"50,50",
"bgratio":"0,100",
"bgangle":"270",
"showborder":"1",
"bordercolor":"767575",
"borderalpha":"50"
},
"data":[{
"label":"Week 1",
"value":"400"
},
{
"label":"Week 2",
"value":"150"
},
{
"label":"Week 3",
"value":"300"
},
{
"label":"Week 4",
"value":"200"
}
]
}
}
]
}
}
]
}
}
]
}
Brief explanation of the data format shown above:
The data for the multi-level LinkedCharts are defined in nested tree structure. The above XML defines data for each level of LinkedCharts in the following way:
- The data for the parent chart is defined at the top with four <set> elements showing sales data for four years
- Each <set> element for parent chart has a link defined to open a LinkedChart by setting an ID (for example, 2004Quarters) of a <linkeddata> node. Each child chart will show Quarterly Sales data for a particular year
- The data source for this first-level child chart (Quarterly Sales chart) is defined in the <linkeddata> nodes defined at the top-level of the XML
- Each <set> element of the Quarterly Sales chart has a link defined to open a second-level LinkedChart, Monthly Sales chart for a particular quarter, for example, monthly data for Quarter 1 of 2004
- The data source for this second-level child chart is defined in the <linkeddata> nodes nested inside the <linkeddata> node or data source of that quarter
- Each <set> element of the Monthly Sales chart has a link defined to open a third-level LinkedChart, Weekly Sales chart for a particular month, for example, weekly data for January for Quarter 1 of 2004
- The data source for this third-level child chart is defined in the <linkeddata> nodes nested inside the <linkeddata> node or data source of that month
Thus described above, the data can go into an endless tree structure to form unlimited drilldown levels.
The data for the multi-level LinkedCharts are defined in nested tree structure. The above JSON defines data for each level of LinkedCharts in the following way:
- The data for the parent chart is defined at the top level "data" property containing sales data for four years
- Each data element for parent chart has a link defined to open a LinkedChart by setting an ID (for example, 2004Quarters) of a linkeddata object. Each child chart will show Quarterly Sales data for a particular year
- The data source for this first-level child chart (Quarterly Sales chart) is defined in the linkeddata element of the top level linkeddata Array
- Each linkeddata Object contains chart data for the respective chart, say Quarterly Sales data for a particular year
- Each data element of the Quarterly Sales chart has a link defined to open a second-level LinkedChart, Monthly Sales chart for a particular quarter, for example, monthly data for Quarter 1 of 2004
- The data source for this second-level child chart is defined in the linkeddata Array nested inside the linkeddata element or data source of that quarter
- Each data element of the Monthly Sales chart has a link defined to open a third-level LinkedChart, Weekly Sales chart for a particular month, for example, weekly data for January for Quarter 1 of 2004
- The data source for this third-level child chart is defined in the linkeddata Array nested inside the linkeddata element or data source of that month
Thus described above, the data can go into an endless tree structure to form unlimited drilldown levels.
The sample will work in different drilldown levels as shown in the images below:
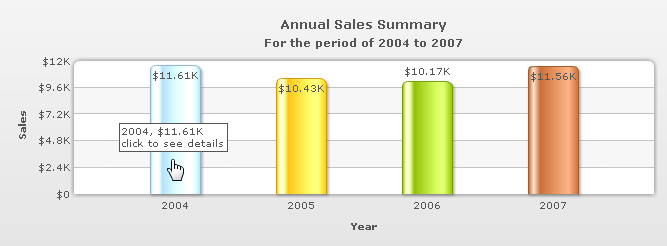 |
| The parent chart showing Annual Sales data. We click on 2004 to drill down. |
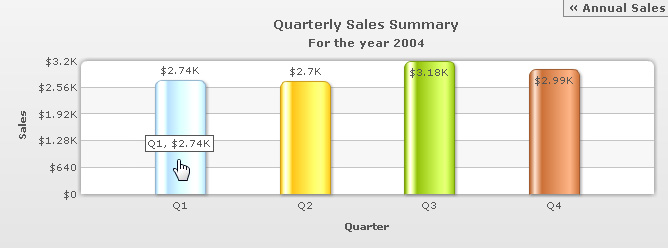 |
| The first-level LinkedChart showing Quarterly Sales data for 2004 replaces the Annual chart. The overlay button at the top right corner shows option to go back to Annual Sales chart (message as per set through configureLink function ). We click on Q1 to drill down to Monthly Sales chart. |
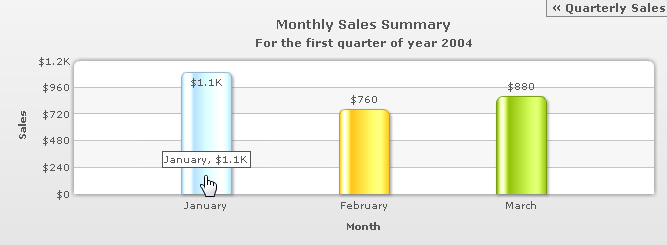 |
| The second level LinkedChart showing Monthly Sales data for Q1 of 2004 replaces the Quarterly chart. The overlay button at the top right corner shows option (message as per set through configureLink function ) to go back to the Quarterly Sales chart. We click on January to drill down again to Weekly Sales chart. |
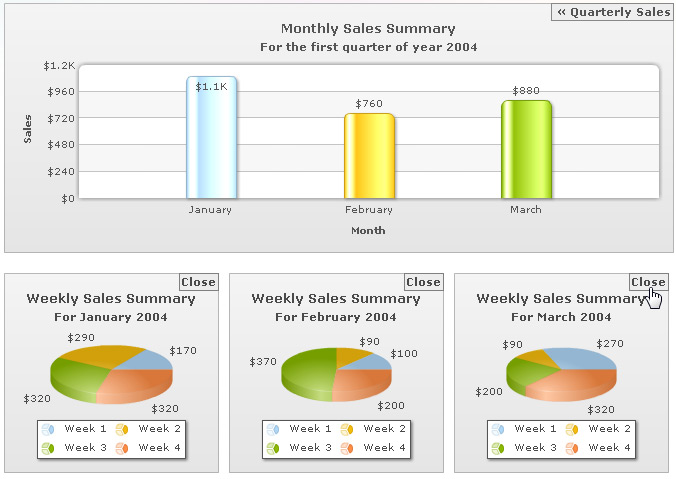 |
| The third-level LinkedChart showing Weekly Sales data for January - Q1 of 2004 is created. As per set through configureLink() function the third level chart is changed to Pie3D chart , rendered with smaller width and height and rendered at a different location. The insert mode is also set to 'append' which keeps on adding a new chart whichever month is clicked. The Close button will remove the chart. |
In FusionCharts XT and JavaScript section's Using LinkedCharts page, we will learn more on listening LinkedCharts events and opening LinkedCharts in jQuery dialog, in a light-box, in extJS window etc.