FusionCharts XT introduces LinkedCharts, which is a smart and efficient method of creating drill-down charts. LinkedCharts are not special chart types. Any chart can be used as a LinkedChart. You can create a master summarized chart whose data-plots, when clicked, will create detailed charts. You can define the data-string or data-url of the detailed charts within the data-source of the master chart.
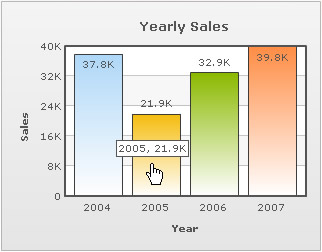
This section shows how to create a single JSON data source using data-string for rendering LinkedCharts. For better understanding, we will create a JSON for a column chart – which shows sales for four years from 2004-2007. Clicking on a column (say 2005) will bring up another chart showing quarterly sales for that year (see image below).
 |
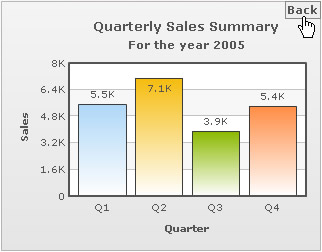 |
| Main chart when the data for year 2005 is clicked | LinkedChart with data for 2005 replaces the main chart |
Watch it live!
To learn how LinkedCharts work, read FusionCharts XT and JavaScript > Using LinkedCharts page.
Embedding data-source as string of LinkedCharts in the data of master chart
Following is the JSON data for a chart which contains LinkedChart data:
{
  "chart":{
    "caption":"Yearly Sales", "xaxisname":"Year", "yaxisname":"Sales" },
  "data":[
    { "label":"2004", "value":"37800", "link":"newchart-json-2004-quarterly" },
    { "label":"2005","value":"21900", "link":"newchart-json-2005-quarterly"  },
    { "label":"2006", "value":"32900", "link":"newchart-json-2006-quarterly" },
    { "label":"2007", "value":"39800", "link":"newchart-json-2007-quarterly" }
  ],
  "linkeddata":[{
      "id":"2004-quarterly",
      "linkedchart":{
        "chart":{
          "caption":"Quarterly Sales Summary",
          "subcaption":"For the year 2004",
          "xaxisname":"Quarter",
          "yaxisname":"Sales"
        },
        "data":[
          { "label":"Q1", "value":"3700" },
          { "label":"Q2", "value":"2900" },
          { "label":"Q3", "value":"3200" },
          { "label":"Q4", "value":"3900" }
        ]
      }
    },
    {
      "id":"2005-quarterly",
      "linkedchart":{
        "chart":{
          "caption":"Quarterly Sales Summary",
          "subcaption":"For the year 2005",
          "xaxisname":"Quarter",
          "yaxisname":"Sales"
        },
        "data":[
          { "label":"Q1", "value":"7800" },
          { "label":"Q2", "value":"2100" },
          { "label":"Q3", "value":"3290" },
          { "label":"Q4", "value":"3800" }
        ]
      }
    },
    {
      "id":"2006-quarterly",
      "linkedchart":{
        "chart":{
          "caption":"Quarterly Sales Summary",
          "subcaption":"For the year 2006",
          "xaxisname":"Quarter",
          "yaxisname":"Sales"
        },
        "data":[
          { "label":"Q1", "value":"3800" },
          { "label":"Q2", "value":"2190" },
          { "label":"Q3", "value":"3290" },
          { "label":"Q4", "value":"3980" }
        ]
      }
    },
    {
      "id":"2007-quarterly",
      "linkedchart":{
        "chart":{
          "caption":"Quarterly Sales Summary",
          "subcaption":"For the year 2007",
          "xaxisname":"Quarter",
          "yaxisname":"Sales"
        },
        "data":[
          { "label":"Q1",  "value":"3780" },
          { "label":"Q2",  "value":"1900" },
          { "label":"Q3",  "value":"2900" },
          { "label":"Q4",  "value":"9800" }
        ]
      }
    }
  ]
}
The initial part of JSON provides the data for the master chart:
{
  "chart":{
    "caption":"Yearly Sales", "xaxisname":"Year", "yaxisname":"Sales" },
  "data":[
    { "label":"2004", "value":"37800", "link":"newchart-json-2004-quarterly"  },
    { "label":"2005", "value":"21900", "link":"newchart-json-2005-quarterly"   },
    { "label":"2006", "value":"32900", "link":"newchart-json-2006-quarterly"  },
    { "label":"2007", "value":"39800", "link":"newchart-json-2007-quarterly"  }
   ],
Note, that every object in the data array contains the link property. The value of this property follows the syntax:
"link":"newchart-json-id"
- newchart - indicates that a click action on the dataplot will lead to rendering of a new LinkedChart
- json - indicates that the new chart will use JSON data
- id - this can be any string, and each object of the data array must have a unique link id. This ID will be searched in the id property under the linkeddata array object, later in the JSON. Once matched, the chart data present in that object, will be used as the data for the LinkedCharts, which opens up when a particular link is clicked.
Next, separate chart objects for each LinkedChart are declared under the linkeddata array. Following JSON code provides data for a drill-down chart, which will render when the first column of the master chart is clicked:
 "linkeddata":[{
      "id":"2004-quarterly",
      "linkedchart":{
        "chart":{
          "caption":"Quarterly Sales Summary",
          "subcaption":"For the year 2004",
          "xaxisname":"Quarter",
          "yaxisname":"Sales"
        },
        "data":[
          { "label":"Q1", "value":"3700" },
          { "label":"Q2", "value":"2900" },
          { "label":"Q3", "value":"3200" },
          { "label":"Q4", "value":"3900" }
        ]
      }
    },
The JSON data of drill-down charts is specified under the linkeddata array, each object in this array contains an id property and a linkedchart object - which holds the JSON data for a drill down chart - corresponding to that id. Essentially, the id helps in mapping each object of the linkeddata array to its corresponding object in the data array object for the master chart. In the above code, the object of the linkeddata array whose id is "2004-quarterly" matches with the id provided in the link property of the first object of the data array pertaining to the master chart " link":"newchart-json-2004-quarterly". Hence, when the first data-plot of the master chart is clicked, the chart that opens up - will take data from this object.
Instead of embedding the data of the LinkedCharts inside the data-source of the master chart, you can also specify the data source URL of the LinkedCharts. See the following code below":
"chart":{
    "caption":"Yearly Sales", "xaxisname":"Year", "yaxisname":"Sales" },
  "data":[
    { "label":"2004", "value":"37800", "link":"newchart-jsonurl-Data2004.json" },
    { "label":"2005","value":"21900",  "link":"newchart-jsonurl-Data2005.json" },
    { "label":"2006", "value":"32900", "link":"newchart-jsonurl-Data2006.json" },
    { "label":"2007", "value":"39800", "link":"newchart-jsonurl-Data2007.json"  }
  ],
Note, here also, every object in the data array contains the link property. The value of this property follows the syntax:
"link":"newchart-jsonurl-url"
- newchart - indicates that a click action on the dataplot will lead to rendering of a new LinkedChart
- jsonurl - indicates that the new chart will get JSON data from a URL
- url - sets the URL of the JSON data source of each LinkedChart
The link property specifies that the new chart will load JSON data from a URL. When the first dataplot is clicked, a drill-down chart will be rendered based on data obtained from Data2004.json.