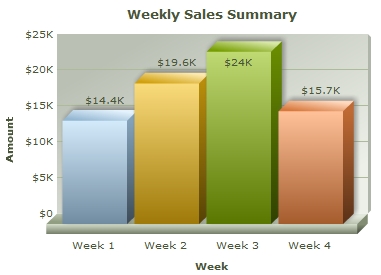
After all the warming up, it is time to build your first chart using FusionCharts XT! Let's start with a simple "Weekly Sales Summary" chart, which we will plot in 3D using a Column Chart. Once done, it should look as under, although with animation and interactivity when you view it live.
Code examples discussed in this section are present in Download Package > Code > MyFirstChart folder
Follow the steps below to get started:
- Create a folder LearningFusionCharts on your hard-drive. We will use this folder as the root folder for building all FusionCharts XT examples.
- Create a folder named MyFirstChart inside the above folder. Inside the MyFirstChart folder, create a folder named FusionCharts.
- Copy Column3D.swf from Download Pack > Charts folder to the FusionCharts folder. This is the SWF file required to render this chart in Flash.
- Copy FusionCharts.js, FusionCharts.HC.js, FusionCharts.HC.Charts.js and jquery.min.js files from Download Pack > Charts folder to FusionCharts folder. These JavaScript files help you easily embed FusionCharts XT in your page and also render the chart in JavaScript, when viewed on a machine or device that does not support Flash.
- Create an XML file » (Creating an XML file is as easy as creating a text file using Windows Notepad or any other text editor. It is actually a plain text file with extension - xml) in MyFirstChart folder with name Data.xml.
- Create the code given below (left), which is the XML-lized form of the sales data shown in the table (right). Copy the XML code to Data.xml file.
<chart caption='Weekly Sales Summary'
   xAxisName='Week' yAxisName='Amount' numberPrefix='$'>
    <set label='Week 1' value='14400' />
    <set label='Week 2' value='19600' />
    <set label='Week 3' value='24000' />
    <set label='Week 4' value='15700' />
</chart>
Week Sales Week 1 $14,400 Week 2 $19,600 Week 3 $24,000 Week 4 $15,700 - Create an HTML file weekly-sales.html in the same folder and copy-paste the code
<html>
  <head>
    <title>My First chart using FusionCharts XT</title>
    <script type="text/javascript" src="FusionCharts/FusionCharts.js">
    </script>
  </head>
  <body>
    <div id="chartContainer">FusionCharts XT will load here!</div>
    <script type="text/javascript"><!--

      var myChart = new FusionCharts( "FusionCharts/Column3D.swf",
      "myChartId", "400", "300", "0" );
      myChart.setXMLUrl("Data.xml");
      myChart.render("chartContainer");

    // -->
    </script>
  </body>
</html>
And that completes the recipe!
Open the file weekly-sales.html in a Web Browser » Internet Explorer, Firefox, Opera, Chrome or Safari (Mac, iPhone, iPad, and Windows) and you will see an animated Column 3D chart similar to the one below:
See it live!
Rendering the chart as JavaScript: The same code can render the chart as JavaScript. You just have to remove the .swf from the file name and the path of the swf file from the existing code. The modified code will look like var myChart = new FusionCharts( "Column3D", ...);. This code will render a JavaScript Column 3D chart. Click here to see the complete code and a live example.
Now that you have already rendered a chart, let's get behind the scenes and understand how FusionCharts XT renders charts in a Web page. Essentially, to create a chart, you need the following four items:
- Chart SWF files: Each chart in FusionCharts XT is an SWF file that creates a specific type of chart. So, if you want to create 3D column chart, you will need the SWF file called Column3D.swf. Similarly for creating a 3D pie chart you will need Pie3D.swf. For the complete list of chart SWF files, refer to the Chart List. The chart SWF file is loaded and rendered using Adobe Flash player plug-in that is installed on your machine (more specifically, browser).
- Chart data: FusionCharts XT data file contains both data for plotting, and cosmetic/functional configuration for the chart. FusionCharts XT accepts data in XML and JSON format. The XML or JSON data document can either be produced manually or generated using server-side scripts that are connected to your databases or live data sources. In the above example, we have used a hand-coded XML file for plotting the chart.
- JavaScript class files: These are also present in the Charts folder in the root of the Download Package. The JavaScript class files help in embedding the chart SWF files into a web page, and also help in rendering JavaScript (HTML5) fallback charts. Additionally, it provides a JavaScript interface for controlling the chart.
- HTML wrapper file (or a dynamic web page): The HTML wrapper file is where the charts are rendered. This file contains the code which integrates all other components (discussed above) to produce the charts.
What happens if Flash player is not available?
In case Flash Player is not available on certain devices (like iPad and iPhone), FusionCharts JavaScript library automatically renders the same chart using JavaScript. If you are running the sample from local file system, please note that you will need to provide the data using Data String method, that is, passing the data (XML/JSON) to the chart as String or JSON Object. Many browsers restrict JavaScript from accessing the local file system owing to security reasons. In the above example, since you had provided data as a URL, the JavaScript charts will not be able to access the same, when running locally. If you run the files from a server, it will run absolutely fine, though. When running locally, however, if you provide the data as string (using the Data String method), it works fine.
Let's take a closer look at the data and its XML form:
<chart caption='Weekly Sales Summary'
   xAxisName='Week' yAxisName='Amount' numberPrefix='$'>
    <set label='Week 1' value='14400' />
    <set label='Week 2' value='19600' />
    <set label='Week 3' value='24000' />
    <set label='Week 4' value='15700' />
</chart> |
|
Basically, what we have done above can be listed in the following points:
- Created the root <chart> element, with a few attributes to define caption, axis titles, and number prefix character.
- Created a <set> element for each data row (in table). The label attribute of this element represents the week name and value attribute represents the sales value for that week. This is the entire data that we wish to plot on the chart. Note how we have removed the number prefix ($) and comma separators from each value before specifying it in XML as <set value='14400'>. FusionCharts XT needs the numbers to be in pure numeric format when specified in XML or JSON.
Note that you can also provide chart data in JSON format. View an example of JSON data here. Or, to learn more about FusionCharts XTJSON data format, please go through FusionCharts XT data formats > JSON section.
In the HTML wrapper file (or your Web page), the shots are called by the included JavaScript class file FusionCharts.js. Let's take a second look at the HTML code to gain an understanding of how it works.
<html>
  <head>
    <title>My First chart using FusionCharts XT</title>
    <script type="text/javascript" src="FusionCharts/FusionCharts.js">
    </script>
  </head>
  <body>
    <div id="chartContainer">FusionCharts XT will load here!</div>
    <script type="text/javascript"><!--

      var myChart = new FusionCharts( "FusionCharts/Column3D.swf",
      "myChartId", "400", "300", "0" );
      myChart.setXMLUrl("Data.xml");
      myChart.render("chartContainer");

    // -->
    </script>
  </body>
</html>
In the very beginning, the JavaScript class file FusionCharts.js is included into the HTML using the code shown below. FusionCharts.js is smart enough to automatically load the other required JavaScript files - jquery.min.js, FusionCharts.HC.Charts.js and FusionCharts.HC.js on-demand. Make sure that all the three JavaScript files are present in the same folder in which FusionCharts.js is located.
<script type="text/javascript" src="FusionCharts/FusionCharts.js"></script>
Next, an HTML DIV with id chartContainer is created in the body of the page.
<div id="chartContainer">FusionCharts XT will load here!</div>
Now comes the essential part, which instantiates the chart. This is called the chart constructor.
var myChart = new FusionCharts( "FusionCharts/Column3D.swf", "myChartId",
      "900", "300", "0" );
Here, myChart is the name of the JavaScript object (variable) that contains reference to the chart.
The following parameters are passed on to the MyChart object:
- Relative URL of the chart SWF file of the chart type that we intend to use. FusionCharts/Column3D.swf in this example as Column3D.swf is the name of SWF and it is contained in a relative path inside FusionCharts folder.
- ID of the chart. You can give any ID for the chart. Just make sure
that if you are using multiple charts in the same HTML page, each chart
should have a unique ID. In our example above, we provide "myChartId" as the ID.
To provide cross-browser compatibility, we recommend you not to start the ID with a numerical value, nor use space as part of the ID. - Required width and height of the chart. When providing in pixels, just give the numeric value (without px).
- debugMode parameter. The debugMode is set to "0" (off) normally except for when debugging is required. This has been explained in detail in the Chart Parameters section on the FusionCharts JavaScript API - Functions page.
Existing users: You might be wondering what happened to the sixth parameter - registerWithJS that comes after debugMode. Starting FusionCharts XT, use of registerWithJS is deprecated. It is always set to 1 internally. Although deprecated, you can continue to use this parameter in your existing code without any problem.
The code below provides the reference (relative URL) of chart data file (XML in this case). The path of the XML file is set using setXMLUrl() function as shown below:
myChart.setXMLUrl( "Data.xml" );
The code sample above uses URL of static XML file. Ideally, you will not use a physical data file. Instead you will have 'your own server side scripts to use dynamic data and build XML. You can always provide the URL of the script to virtually relay the dynamically built data.
Finally, the render() method is called and the ID of HTML DIV, where the chart is meant to be rendered, is provided. This line of code renders the desired chart inside the DIV.
myChart.render( "chartContainer" );
Existing users : You might be wondering what happened to the functions like setDataURL()which you have already been using in your application. Yes - although deprecated, it will continue to work without any problem.
FusionCharts XT also provides alternate methods of declaring and rendering a chart using JavaScript.
You can use a compact single-line of JavaScript (instead of the three lines we saw in the above sample) to render a chart as shown below:
<html>
  <head>
     <title>My First chart using FusionCharts XT - Compact Rendering Method</title>
	  <script type="text/javascript" src="FusionCharts/FusionCharts.js"></script>
  </head>
  <body>
     <div id="chartContainer">FusionCharts XT will load here!</div>
	  <script type="text/javascript"><!--

        var myChart = FusionCharts.render( "FusionCharts/Column3D.swf",
            "myChartId", "400", "300", "chartContainer", "Data.xml" );

	   // -->
	  </script>
  </body>
</html>
See it live!
There are additional ways of rendering a chart as well, which have been explained in the Creating charts page in "FusionCharts XT and JavaScript" section.
If for any reason, you do not see a chart, run through the following checks:
If you see an endless loading progress bar in your browser, or if the right click menu (right click at the place where the chart is supposed to be) shows "Movie not loaded", check the following:
- Have you pasted the chart SWF and JavaScript files (FusionCharts.js, FusionCharts.HC.js, FusionCharts.HC.Charts.js and jquery.min.js) in the Charts folder of MyFirstChart folder?
- Have you provided the SWF path properly in your weekly-sales.html page?
If you get an "Error in Loading Data" message, check the following:
- Whether Data.xml is in the same folder as the weekly-sales.html HTML file.
- Whether Data.xml is named as Data.xml and not Data.xml.txt? (as many basic text editors append .txt after the file name).
- Whether your chart files (SWF and JavaScript) and XML/JSON data are on the same sub-domain. Cross domain data loading is not allowed.
If you get an "Invalid Data" message, it means that the XML/JSON data is malformed. Check it again for common errors like:
- Presence of duplicate attributes in the XML/JSON.
- Difference in case of tags. <chart> should end with </chart> and not </Chart> or </CHART>.
- Missing opening or closing quotation marks for any attributes. For example, <chart caption=Weekly Sales Summary' should be <chart caption='Weekly Sales Summary'
- Missing closing tag for any element in the XML.
To check whether your final XML is fine, open it in your browser and you will see the error.
If only the text "FusionCharts XT will load here!" is displayed, check with the following:
- Have you pasted the FusionCharts.js, jquery.min.js, FusionCharts.HC.js and FusionCharts.HC.Charts.js files in FusionCharts folder of MyFirstChart folder?
- Have you included and provided the path of FusionCharts.js properly in your weekly-sales.html page?
- Are there any JavaScript syntax or runtime errors that might have halted the execution of FusionCharts functions?
- Have you given unique names for the chart's JavaScript variable, chart's ID and the HMTL DIV's ID?
To provide cross-browser compatibility, we recommend you not to start the ID with a numerical value, nor use space as part of the ID.