Bubble and scatter charts are used for plotting data that can be defined in terms of multiple numeric parameters. In these charts, both X and Y axes are numeric. So, the position of a data point is an indicator of two distinct numeric values.
The scatter chart is used for plotting data which is defined in terms of two numeric parameters.
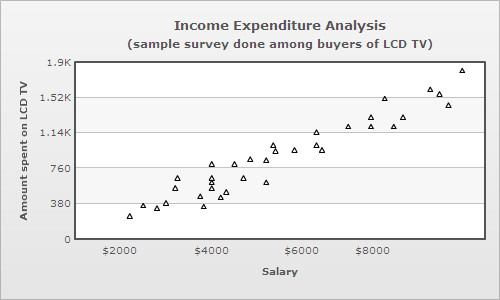
Scatter charts are multi-series charts, but their data format is slightly different from that of conventional multi-series charts. Following is the data for the above chart:
<chart caption='Income Expenditure Analysis' subcaption='(sample survey done among buyers of LCD TV)'
	xAxisName='Salary' yAxisName='Amount spent on LCD TV'>
  <categories>
    <category x='0' />
    <category label='$2000' x='2000' />
    <category label='$4000' x='4000' />
    <category label='$6000' x='6000' />
    <category label='$8000' x='8000' />
    <category x='10000'/>
  </categories>
  <dataset color='000000'>
    <set x='2500' y='350' />
    <set x='2200' y='240' />
    <set x='3000' y='380' />
    <set x='2800' y='325' />
    <set x='3250' y='650' />
    <set x='3200' y='541' />
. . .
  </dataset>
</chart>
{
  "chart":{
    "caption":"Income Expenditure Analysis",
    "subcaption":"(sample survey done among buyers of LCD TV)",
    "xaxisname":"Salary",
    "yaxisname":"Amount spent on LCD TV"
  },
  "categories":[{
      "category":[{
          "x":"0"
        },
        {
          "name":"$2000",
          "x":"2000"
        },
        {
          "name":"$4000",
          "x":"4000"
        },
        {
          "name":"$6000",
          "x":"6000"
        },
        {
          "name":"$8000",
          "x":"8000"
        },
        {
          "x":"10000"
        }
      ]
    }
  ],
  "dataset":[{
      "color":"000000",
      "data":[{
          "x":"2500",
          "y":"350"
        },
        {
          "x":"2200",
          "y":"240"
        },
        {
          "x":"3000",
          "y":"380"
        },
        {
          "x":"2800",
          "y":"325"
        },
        {
          "x":"3250",
          "y":"650"
        },
        {
          "x":"3200",
          "y":"541"
        }
      ]
    }
  ]
...
}
The bubble chart is used for plotting data, which is defined in terms of three numeric parameters. The third numeric parameter is indicated by the diameter of the bubble.
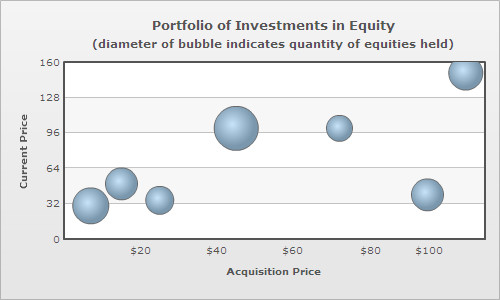
The XML/JSON format of a bubble chart is slightly different from that of a scatter chart, this is because the bubble chart plots an additional numeric parameter. Following is the data for the above chart:
<chart caption='Portfolio of Investments in Equity'
	subcaption='(diameter of bubble indicates quantity of equities held)'
	xAxisName='Acquisition Price' yAxisName='Current Price' >
  <categories>
    <category x='0' />
    <category label='$20' x='20' />
    <category label='$40' x='40' />
    <category label='$60' x='60' />
    <category label='$80' x='80' />
    <category label='$100' x='100' />
    <category x='120' />
  </categories>
  <dataset>
    <set x='7' y='30' z='1000' name='A' />
    <set x='45' y='100' z='1500' name='B' />
    <set x='72' y='100' z='500' name='C' />
    <set x='95' y='40' z='800' name='D' />
    <set x='105' y='150' z='900' name='E' />
    <set x='25' y='35' z='600' name='F' />
    <set x='15' y='50' z='800' name='G' />
  </dataset>
</chart>
{
  "chart":{
    "caption":"Portfolio of Investments in Equities",
    "subcaption":"(diameter of bubble indicates quantity of equities held)",
    "xaxisname":"Acquisition Price",
    "yaxisname":"Current Price"
  },
  "categories":[{
      "category":[{
          "x":"0"
        },
        {
          "label":"$20",
          "x":"20"
        },
        {
          "label":"$40",
          "x":"40"
        },
        {
          "label":"$60",
          "x":"60"
        },
        {
          "label":"$80",
          "x":"80"
        },
        {
          "label":"$100",
          "x":"100"
        },
        {
          "x":"120"
        }
      ]
    }
  ],
  "dataset":[{
      "data":[{
          "x":"7",
          "y":"30",
          "z":"1000",
          "name":"A"
        },
        {
          "x":"45",
          "y":"100",
          "z":"1500",
          "name":"B"
        },
        {
          "x":"72",
          "y":"100",
          "z":"500",
          "name":"C"
        },
        {
          "x":"95",
          "y":"40",
          "z":"800",
          "name":"D"
        },
        {
          "x":"105",
          "y":"150",
          "z":"900",
          "name":"E"
        },
        {
          "x":"25",
          "y":"35",
          "z":"600",
          "name":"F"
        },
        {
          "x":"15",
          "y":"50",
          "z":"800",
          "name":"G"
        }
      ]
    }
  ]
}
In case of bubble and scatter charts categories are optional, since the X axis is numeric. So, categories can be used to define customized X axis labels at any location in the X scale. A category can define numeric or non-numeric labels for the X axis. Unlike other multi-series charts where each dataset contains the same number of <set> elements as the number of categories, scatter and bubble charts can have varying number of <set> elements under each dataset. In case categories are not defined, the X axis displays an automatically calculated numeric scale with vertical divisional lines and values of the divisional lines as X axis labels. However, you can also explicitly define categories of your choice and show only those categories as X axis labels. Moreover, you can also combine the categories and automatically generated X axis labels using a mixed mode. Read Configuring the X axis labels of bubble/scatter charts to learn more on how to use these modes.
Labels can be displayed on each bubble of a bubble chart. For this, however, every <set> element must be allotted a label or an identifier using name attribute:
<set x='45' y='100' z='1500' name='B' />
To make the labels visible over the bubbles, showValues attribute must be declared in the <chart> element:
<chart showValues='1' . . . />

Dividing the canvas of a bubble/scatter chart into quadrants makes analysis of the chart easier. Quadrant lines can be added to the chart by declaring drawQuadrant attribute of the <chart> element.
<chart drawQuadrant='1' . . . >
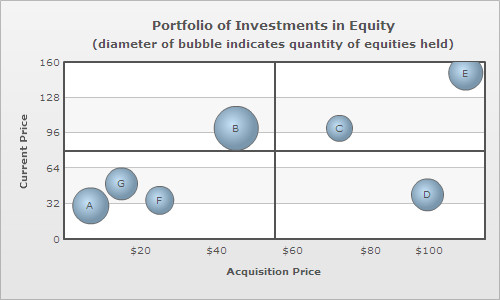
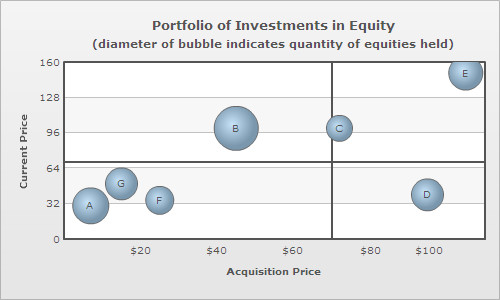
By default, the quadrant lines appear at the center of the canvas, but their position can be customized using quadrantXVal and quadrantYVal attributes. quadrantXVal sets the position of the vertical quadrant line relative to the X axis and quadrantYVal sets the position of the horizontal quadrant line relative to the Y axis. The value of these attributes must be within the range of their corresponding relative axis (and not pixels). In the chart above, since both X and Y axis ranges from 0-120, the following data is used to customize the position of the quadrant lines:
<chart quadrantXVal='70' quadrantYVal='70' . . . >
Each quadrant can have its own title in the form of a label. The attributes for defining labels for the upper quadrants are quadrantLabelTL and quadrantLabelTR (TL for top-left and TR for top-right quadrant). Similarly, the attributes for defining the labels for the lower quadrants are quadrantLabelBL and quadrantLabelBR (BL for bottom-left and BR for bottom-right quadrant).
<chart quadrantLabelTL='Good' quadrantLabelTR='Moderate' quadrantLabelBL='Stagnant' quadrantLabelBR='Bad' . . . >

Customization of quadrant lines and labels can be done using following attributes:
| Attribute Name | Type | Range | Description |
| quadrantLineColor | Color | Hex Code | Lets you set the color of the quadrant lines |
| quadrantLineThickness | Number | In Pixels | Lets you set the thickness of the quadrant lines |
| quadrantLineAlpha | Number | 0-100 | Lets you control the transparency of the quadrant lines |
| quadrantLineIsDashed | Boolean | 1/0 | Whether the quadrant lines should appear as dashed |
| quadrantLineDashLen | Number | In Pixels | If you've opted to show quadrant lines as dashed, this attribute lets you specify the length of the dash. |
| quadrantLineDashGap | Number | In Pixels | If you've opted to show quadrant lines as dashed, this attribute lets you specify the length of the gap between two dash. |
| quadrantLabelPadding | Number | In Pixels | This attribute lets you control the space between quadrant labels and the canvas border. |
The X-axis of bubble/scatter chart can be segmented into categorical zones using vertical trend lines.
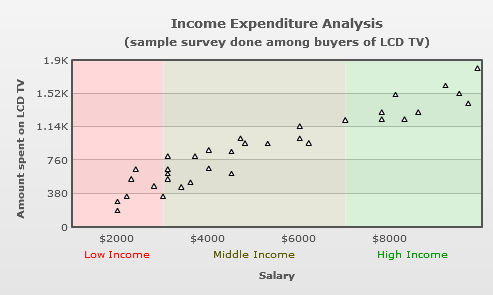
Segmentation of the X-axis is done in the following manner:
 <vTrendLines>
    <line startValue='1000' endValue='3000' displayValue='Low Income' isTrendZone='1' color='FF0000' alpha='5'/>
    <line startValue='3000' endValue='7000' displayValue='Middle Income' isTrendZone='1' color='5B5B00' alpha='5'/>
    <line startValue='7000' endValue='10000' displayValue='High Income' isTrendZone='1' color='009900' alpha='5'/>
 </vTrendLines>
"vtrendlines":[{
      "line":[{
          "startvalue":"1000",
          "endvalue":"3000",
          "displayvalue":"Low Income",
          "istrendzone":"1",
          "color":"FF0000",
          "alpha":"5"
        },
        {
          "startvalue":"3000",
          "endvalue":"7000",
          "displayvalue":"Middle Income",
          "istrendzone":"1",
          "color":"5B5B00",
          "alpha":"5"
        },
        {
          "startvalue":"7000",
          "endvalue":"10000",
          "displayvalue":"High Income",
          "istrendzone":"1",
          "color":"009900",
          "alpha":"5"
        }
      ]
    }
  ]
Starting FusionCharts XT, you can configure the display mode of the x-axis labels in scatter and bubble charts. You can either choose to make the chart automatically generate the X Axis labels along with vertical divisional lines or you can explicitly define each X Axis label. Additionally, you can also opt to mix these two modes. The attribute which takes care of these modes is xAxisLabelMode.
There are three different modes in which you can display the x-axis labels. These are as follows:
- Auto mode - In auto mode, the chart automatically calculates and displays the x-axis labels. In this mode, the chart ignores the <categories> element and allows the x-axis to inherit the properties similar to that of the vertical Y-Axis.
- Categories mode - In this mode, the x-axis displays labels explicitly defined through the <category> elements within <categories> element.
- Mixed mode - This mode is a combination of auto mode and category mode. It allows the x-axis to display both automatically calculated x-axis labels and the explicitly defined x-axis labels simultaneously.
In the section below, we will learn how to apply any of these modes.
Auto mode: (xAxisLabelMode='auto')
<chart xAxisLabelMode='auto'
	caption='Income Expenditure Analysis'
	subcaption='(sample survey done among buyers of LCD TV)'
	xAxisName='Salary' yAxisName='Amount spent on LCD TV'>

  <dataset color='000000'>
    <set x='9200' y='1600' />
    <set x='9900' y='1800' />
    <set x='9500' y='1510' />
    <set x='9700' y='1400' />
    <set x='8100' y='1500' />
    <set x='8600' y='1300' />
    <set x='8300' y='1220' />
    <set x='7800' y='1300' />
    <set x='7800' y='1220' />
    <set x='7000' y='1210' />
    <set x='6000' y='1140' />
    <set x='6000' y='1000' />
    <set x='6200' y='950' />
    <set x='5300' y='940' />
    <set x='4700' y='1000' />
    <set x='4800' y='947' />
    <set x='4500' y='850' />
    <set x='4000' y='870' />
    <set x='3700' y='800' />
    <set x='3100' y='800' />
    <set x='4500' y='600' />
    <set x='4000' y='660' />
    <set x='3600' y='500' />
    <set x='3400' y='450' />
    <set x='3100' y='650' />
    <set x='3100' y='600' />
    <set x='3100' y='540' />
    <set x='2800' y='460' />
    <set x='2400' y='650' />
    <set x='2300' y='540' />
    <set x='3000' y='340' />
    <set x='2000' y='280' />
    <set x='2200' y='340' />
    <set x='2000' y='180' />
  </dataset>

</chart>
The chart for the above data will look as under:
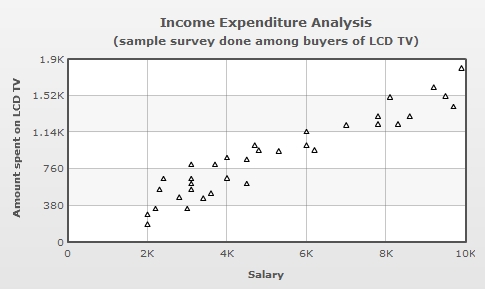
Note: In auto mode none of the advanced label management features will be applicable to the X axis labels.
In the above chart, you can see that the x-axis labels are automatically calculated and displayed. These x-axis labels are based on x-axis values which in turn are generated using the x values of the chart data. Additionally, along with each label a vertical divisional line is also rendered. You can also configure these vertical divisional lines. Please read Quick Chart Configuration > Div Lines & Grids to know more on how to configure these vertical divisional lines.
For this example, we have modified the data used in the above sample. We have explicitly added some <category> elements in the data as shown below:
<chart xAxisLabelMode='categories'
	caption='Income Expenditure Analysis'
	subcaption='(sample survey done among buyers of LCD TV)'
	xAxisName='Salary' yAxisName='Amount spent on LCD TV'>

  <categories>

    <category label='Low' x='1200' showVerticalLine='1' lineDashed='1'/>
    <category label='Avg' x='5000' showVerticalLine='1' lineDashed='1'/>
    <category label='High' x='9000' showVerticalLine='1' lineDashed='1'/>

  </categories>

   <dataset color='000000'>
    <set x='9200' y='1600' />
    <set x='9900' y='1800' />
    <set x='9500' y='1510' />
    <set x='9700' y='1400' />
    <set x='8100' y='1500' />
    <set x='8600' y='1300' />
    <set x='8300' y='1220' />
    <set x='7800' y='1300' />
    <set x='7800' y='1220' />
    <set x='7000' y='1210' />
    <set x='6000' y='1140' />
    <set x='6000' y='1000' />
    <set x='6200' y='950' />
    <set x='5300' y='940' />
    <set x='4700' y='1000' />
    <set x='4800' y='947' />
    <set x='4500' y='850' />
    <set x='4000' y='870' />
    <set x='3700' y='800' />
    <set x='3100' y='800' />
    <set x='4500' y='600' />
    <set x='4000' y='660' />
    <set x='3600' y='500' />
    <set x='3400' y='450' />
    <set x='3100' y='650' />
    <set x='3100' y='600' />
    <set x='3100' y='540' />
    <set x='2800' y='460' />
    <set x='2400' y='650' />
    <set x='2300' y='540' />
    <set x='3000' y='340' />
    <set x='2000' y='280' />
    <set x='2200' y='340' />
    <set x='2000' y='180' />
  </dataset>


</chart>
The chart for the above data will look as under:
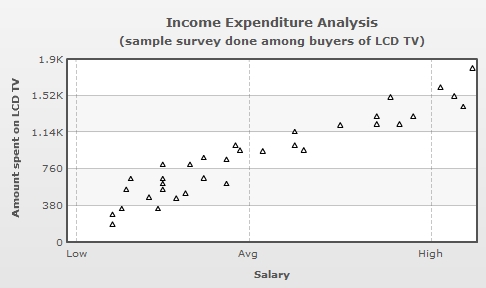
In the above chart, you can see that the labels explicitly defined in the <category> elements within the <categories> element are displayed. Note, that the automatically calculated labels are not displayed.
To display mixed mode, we have set xAxisLabelMode='mixed' in the above data.
<chart caption='Income Expenditure Analysis' xAxisLabelMode='mixed'... >
The chart for the above data will look as under:
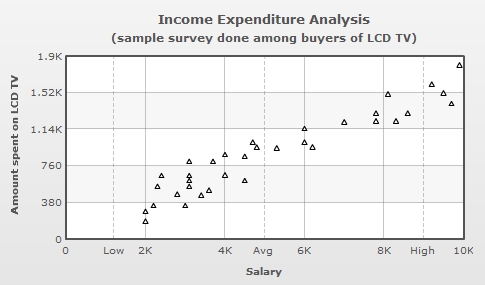
In the above chart, you can see that the x-axis displays both automatically calculated labels and the explicitly defined labels through the <category> elements.
NOTE: By default, when xAxisLabelMode attribute is not defined and when categories are not explicitly defined in the data, the chart displays X axis labels using auto mode. In case, categories are defined ( and xAxisLabelMode attribute is not defined), the chart switches to categories mode. You can also force any of the above three modes by explicitly defining the mode using the xAxisLabelMode attribute.
Starting FusionCharts XT, you can configure the vertical divisional lines related to the x-axis. The attributes used are as follows:
| Attribute Name | Range | Description |
| adjustVDiv Since v3.2.2 |
Boolean | FusionCharts XT automatically tries to adjust divisional lines and limit values of the x-axis based on the data provided. However, if you want to set your explicit lower and upper limit values and number of divisional lines for the x-axis, first set this attribute to 0. That will disable automatic adjustment of divisional lines. |
| showXAxisValues
Since v3.2.2 |
Boolean | The x-axis is divided into horizontal sections using div (divisional) lines. Each div line assumes a value based on its position. Using this attribute you can set whether to show those div line (x-axis) values or not. This attribute shows or hides the x-axis divisional lines and limits. |
|
numVDivlines Since v3.2.2 |
Numeric Value > 0 | Number of vertical axis division lines that you want to display on the chart. |
| xAxisValuesStep Since v3.2.2 |
Number 1 or above | By default, all div lines show their values. However, you can opt to skip every x(th) div line value using this attribute. |
|
vDivlineColor Since v3.2.2 |
Hex Code | Color for vertical divisional lines. |
|
vDivlineThickness Since v3.2.2 |
1-5 | Thickness of vertical divisional lines. |
|
vDivlineAlpha Since v3.2.2 |
0-100 | Transparency of the vertical divisional lines. |
|
vDivlineIsDashed Since v3.2.2 |
0/1 | Whether the vertical divisional lines should display as dash. |
|
vDivlineDashLen Since v3.2.2 |
In Pixels | If the vertical divisional lines are to be displayed as dash, this attribute lets you control the length of each dash. |
|
vDivlineDashGap Since v3.2.2 |
In Pixels | If the vertical divisional lines are to be displayed as dash, this attribute lets you control the length of each gap between two dashes. |
|
showAlternateVGridColor
Since v3.2.2 |
0/1 | Whether to show alternate colored vertical grid bands. |
|
alternateVGridColor
Since v3.2.2 |
Hex Code | Color of the alternate vertical grid bands. |
|
alternateVGridAlpha
Since v3.2.2 |
0-100 | Transparency of the alternate vertical grid bands. |
Starting FusionCharts XT, you can configure the formatting of the numbers present on the y-axis and x-axis individually. You can also opt to use the same number formatting on both the axes. The attributes used for formatting the numbers are as follows:
| Attribute Name | Type | Range | Description |
| formatNumber | Boolean | 0/1 | This configuration determines whether the numbers displayed on the chart will be formatted using commas, e.g., 40,000 if formatNumber='1' and 40000 if formatNumber='0'. The value of this attribute works only if yFormatNumber and xFormatNumber attributes are not specifically mentioned. |
|
yFormatNumber
Since v3.2.2
|
Boolean | 0/1 | This configuration determines whether the numbers displayed on the y-axis of the chart will be formatted using commas, e.g., 40,000 if formatNumber='1' and 40000 if formatNumber='0'. If this attribute is not specifically mentioned, the chart inherits the default value from formatNumber attribute. |
|
xFormatNumber
Since v3.2.2
|
Boolean | 0/1 | This configuration determines whether the numbers displayed on the x-axis of the chart will be formatted using commas, e.g., 40,000 if formatNumber='1' and 40000 if formatNumber='0'. If this attribute is not specifically mentioned, the chart inherits the default value from formatNumber attribute. |
| formatNumberScale | Boolean | 0/1 | Configuration whether to add K (thousands) and M (millions) to a number after truncating and rounding it - e.g., if formatNumberScale is set to 1, 1043 will become 1.04K (with decimals set to 2 places). Same with numbers in millions - an M will be added at the end. The value of this attribute works only if yFormatNumberScale and xFormatNumberScale attributes are not specifically mentioned.For more details, please see Advanced Number Formatting section. |
|
yFormatNumberScale
Since v3.2.2
|
Boolean | 0/1 | Configuration whether to add K (thousands) and M (millions) to a number after truncating and rounding it on the y-axis - e.g., if yFormatNumberScale is set to 1, 1043 will become 1.04K (with decimals set to 2 places). Same with numbers in millions - an M will be added at the end. If this attribute is not specifically mentioned, the chart inherits the default value from formatNumberScale attribute. |
|
xFormatNumberScale
Since v3.2.2
|
Boolean | 0/1 | Configuration whether to add K (thousands) and M (millions) to a number after truncating and rounding it on the x-axis - e.g., if xFormatNumberScale is set to 1, 1043 will become 1.04K (with decimals set to 2 places). Same with numbers in millions - an M will be added at the end. If this attribute is not specifically mentioned, the chart inherits the default value from formatNumberScale attribute |
| defaultNumberScale | String | The default unit of the numbers that you're providing to the chart. The value of this attribute works only if yDefaultNumberScale and xDefaultNumberScale attributes are not specifically mentioned.For more details, please see Advanced Number Formatting section. | |
|
yDefaultNumberScale
Since v3.2.2
|
String | The default unit of the numbers of the y-axis that you're providing to the chart. If this attribute is not specifically mentioned, the chart inherits the default value from DefaultNumberScale attribute. For more details, please see Advanced Number Formatting section. | |
|
xDefaultNumberScale
Since v3.2.2
|
String | The default unit of the numbers of the x-axis that you're providing to the chart. If this attribute is not specifically mentioned, the chart inherits the default value from DefaultNumberScale attribute. For more details, please see Advanced Number Formatting section. | |
| numberScaleUnit | String | Unit of each block of the scale. The value of this attribute works only if yNumberScaleUnit and xNumberScaleUnit attributes are not specifically mentioned. For more details, please see Advanced Number Formatting section. | |
|
yNumberScaleUnit
Since v3.2.2
|
String | Unit of each block of the scale of the y-axis. If this attribute is not specifically mentioned, the chart inherits the default value from NumberScaleUnit attribute. For more details, please see Advanced Number Formatting section. | |
|
xNumberScaleUnit
Since v3.2.2
|
String | Unit of each block of the scale of the x-axis. If this attribute is not specifically mentioned, the chart inherits the default value from NumberScaleUnit attribute. For more details, please see Advanced Number Formatting section. | |
| numberScaleValue | String | Range of the various blocks that constitute the scale. The value of this attribute works only if yNumberScaleValue and xNumberScaleValue attributes are not specifically mentioned. For more details, please see Advanced Number Formatting section. | |
|
yNumberScaleValue
Since v3.2.2
|
String | Range of the various blocks that constitute the y-axis scale. If this attribute is not specifically mentioned, the chart inherits the default value from NumberScaleValue attribute. For more details, please see Advanced Number Formatting section. | |
|
xNumberScaleValue
Since v3.2.2
|
String | Range of the various blocks that constitute the x-axis scale. If this attribute is not specifically mentioned, the chart inherits the default value from NumberScaleValue attribute. For more details, please see Advanced Number Formatting section. | |
| numberPrefix | String | Character | Using this attribute, you could add prefix to all the numbers visible on the graph. For example, to represent all dollars figure on the chart, you could specify this attribute to ' $' to show like $40000, $50000. The value of this attribute works only if yNumberPrefix and xNumberPrefix attributes are not specifically mentioned. For more details, please see Advanced Number Formatting section. |
|
yNumberPrefix
Since v3.2.2
|
String | Character | Using this attribute, you could add prefix to all the numbers visible on the y-axis. For example, to represent all dollars figure on the y-axis, you could specify this attribute to ' $' to show like $40000, $50000. If this attribute is not specifically mentioned, the chart inherits the default value from NumberPrefix attribute. For more details, please see Advanced Number Formatting section. |
|
xNumberPrefix
Since v3.2.2
|
String | Character | Using this attribute, you could add prefix to all the numbers visible on the x-axis. For example, to represent all dollars figure on the x-axis, you could specify this attribute to ' $' to show like $40000, $50000. If this attribute is not specifically mentioned, the chart inherits the default value from NumberPrefix attribute. For more details, please see Advanced Number Formatting section. |
| numberSuffix | String | Character | Using this attribute, you could add a suffix to all the numbers visible on the graph. For example, to represent all figure quantified as per annum on the chart, you could specify this attribute to ' /a' to show like 40000/a, 50000/a. The value of this attribute works only if yNumberSuffix and xNumberSuffix attributes are not specifically mentioned. For more details, please see Advanced Number Formatting section. |
|
yNumberSuffix
Since v3.2.2
|
String | Character | Using this attribute, you could add a suffix to all the numbers visible on the y-axis. For example, to represent all figure quantified as per annum on the y-axis, you could specify this attribute to ' /a' to show like 40000/a, 50000/a. If this attribute is not specifically mentioned, the chart inherits the default value from NumberSuffix attribute. For more details, please see Advanced Number Formatting section. |
|
xNumberSuffix
Since v3.2.2
|
String | Character | Using this attribute, you could add a suffix to all the numbers visible on the x-axis. For example, to represent all figure quantified as per annum on the x-axis, you could specify this attribute to ' /a' to show like 40000/a, 50000/a.If this attribute is not specifically mentioned, the chart inherits the default value from NumberSuffix attribute. For more details, please see Advanced Number Formatting section. |
| decimalSeparator | String | Character | This option helps you specify the character to be used as the decimal separator in a number. For more details, please see Advanced Number Formatting section. |
| thousandSeparator | String | Character | This option helps you specify the character to be used as the thousands separator in a number. For more details, please see Advanced Number Formatting section. |
| inDecimalSeparator | String | Character | In some countries, commas are used as decimal separators and dots as thousand separators. In XML, if you specify such values, it will give an error while converting to number. So, FusionCharts XT accepts the input decimal and thousand separator from user, so that it can convert it accordingly into the required format. This attribute lets you input the decimal separator. For more details, please see Advanced Number Formatting section. |
| inThousandSeparator | String | Character | In some countries, commas are used as decimal separators and dots as thousand separators. In XML, if you specify such values, it will give an error while converting to number. So, FusionCharts XT accepts the input decimal and thousand separator from user, so that it can convert it accordingly into the required format. This attribute lets you input the thousand separator. For more details, please see Advanced Number Formatting section. |
| decimals | Number | 0-10 | Number of decimal places to which all numbers on the chart will be rounded to. |
| forceDecimals | Boolean | 0-10 | Whether to add 0 padding at the end of decimal numbers. For example, If you limit the maximum number of decimal digits to 2, a number like 55.345 will be rounded to 55.34. This does not mean that all numbers will be displayed with a fixed number of decimal places. For instance 55 will not be displayed as 55.00 and 55.1 will not become 55.10. In order to have fixed number of decimal places attached to all the numbers, set this attribute to 1. |
| forceYAxisValueDecimals
Since v 3.2 |
Boolean | 0/1 | Whether to forcefully attach decimal places to all y-axis values. For example, If you limit the maximum number of decimal digits to 2, a number like 55.345 will be rounded to 55.34. This does not mean that all y-axis numbers will be displayed with a fixed number of decimal places. For instance 55 will not be displayed as 55.00 and 55.1 will not become 55.10. In order to have fixed number of decimal places attached to all y-axis numbers, set this attribute to 1. |
| forceXAxisValueDecimals
Since v3.2.2 |
Boolean | 0/1 | Whether to forcefully attach decimal places to all x-axis values. For example, If you limit the maximum number of decimal digits to 2, a number like 55.345 will be rounded to 55.34. This does not mean that all x-axis numbers will be displayed with a fixed number of decimal places. For instance 55 will not be displayed as 55.00 and 55.1 will not become 55.10. In order to have fixed number of decimal places attached to all x-axis numbers, set this attribute to 1. |
| yAxisValueDecimals | Number | 0-10 | If you've opted to not adjust div lines, you can specify the div line values decimal precision using this attribute. |
|
xAxisValueDecimals
Since v3.2.2
|
Number | 0-10 | If you've opted not to adjust vertical div lines, you can specify the decimal precision of the div line values using this attribute. |
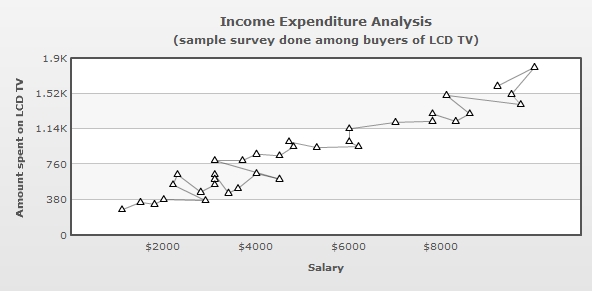
In scatter charts, all the data points can be connected by a line. This can be done by declaring drawLine attribute of the <dataset> element as under:
<dataset drawLine="1" . . . >
Following scatter chart shows a line connecting all the data plots of a scatter chart.
Starting FusionCharts XT, scatter and bubble charts can draw regression lines based on the values provided to the charts.
In a scatter or a bubble chart, each data point has two distinct numeric values, one (x value) with respect to the X axis and the other (y value) with respect to the Y axis. A regression line shows the trend of the y values with respect to the x values or the trend of the x values with respect to the y values. Hence, a regression line can be used to derive a particular trend from the scattered data points in the chart canvas and predict values accordingly.
The regression line is shown as a straight line.
Regression line can be used to find trend and predict future sales, stock prices, currency exchange rates, productivity gains resulting from a training program etc.
There are several methods to calculate and draw regression lines. The scatter and bubble charts of FusionCharts XT uses Linear Regression and least-squares or least absolute deviation method. This method calculates the best-fitting straight-line for the observed data by minimizing the sum of the squares of the vertical deviations from each data point to the line (if a point lies on the fitted line exactly, then its vertical deviation is 0). Because the deviations are first squared, then summed, there are no cancellations between positive and negative values.
To show the regression line you will need to declare showRegressionLine='1' in <chart> or <dataset> element.
To display regression lines of all the datasets of a chart you need to declare showRegressionLine='1' in the <chart> element. You can show the regression line for a particular <dataset> element declaring showRegressionLine='1' in that particular <dataset> element.
<chart showRegressionLine="1" . . . >
<dataset showRegressionLine="1" . . . >
Following scatter chart shows a regression line:

The chart uses one of the two modes to display a regression line:
- Y on X : When y values are predicted or a trend of y values are calculated based on the x values
- X on Y : When x values are predicted or a trend of x values are calculated based on the y values
By default, scatter and bubble charts use Y on X mode to draw the regression lines. However, you can select the X on Y mode setting showYOnX = '0' in <chart> or <dataset> element.
Y on X – The regression equation of Y on X is the equation of the best fitting straight line in the form y= a+bx, where x is the explanatory variable and y is the dependent variable.
When, b = ( n . Σ (x.y) - (Σ x).(Σ y) )/ (n Σx² – (Σx)² )
X on Y - The regression equation of X on Y is the equation of the best fitting straight line in the form x= a+by, where y is the explanatory variable and x is the dependent variable.
When, b = ( n . Σ (x.y) - (Σ x).(Σ y) )/ (n Σy² – (Σy)² )
A chart shown below draws a regression line to show the trend of the amount spent on LCD TV (y values) with relation to buyer's salary brackets (x value). Hence, this is using Y on X mode.
Another chart below shows the regression trend of buyer's economic status (salary as x values) with relation to price of LCD TV (amount spent on y values). Hence, this is using X on Y mode.
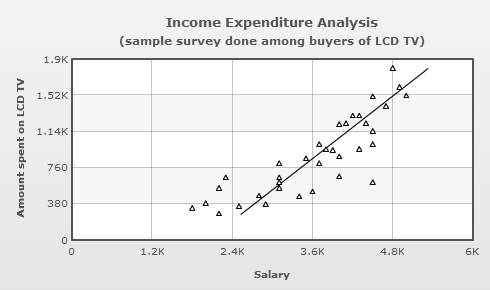
<chart showRegressionLine='1' showYOnX='0' xAxisLabelmode='auto'
       caption='Income Expenditure Analysis'
       subcaption='(sample survey done among buyers of LCD TV)'
       xAxisName='Salary' yAxisName='Amount spent on LCD TV' >

<dataset color='000000'>
    <set x='4900' y='1600' />
    <set x='4800' y='1800' />
    <set x='5000' y='1510' />
    <set x='4700' y='1400' />
    <set x='4500' y='1500' />
    <set x='4300' y='1300' />
    <set x='4400' y='1220' />
    <set x='4200' y='1300' />
    <set x='4100' y='1220' />
    <set x='4000' y='1210' />
    <set x='4500' y='1140' />
    <set x='4500' y='1000' />
    <set x='4300' y='950' />
    <set x='3900' y='940' />
    <set x='3700' y='1000' />
    <set x='3800' y='947' />
    <set x='3500' y='850' />
    <set x='4000' y='870' />
    <set x='3700' y='800' />
    <set x='3100' y='800' />
    <set x='4500' y='600' />
    <set x='4000' y='660' />
    <set x='3600' y='500' />
    <set x='3400' y='450' />
    <set x='3100' y='650' />
    <set x='3100' y='600' />
    <set x='3100' y='540' />
    <set x='2800' y='460' />
    <set x='2300' y='650' />
    <set x='2200' y='540' />
    <set x='2900' y='370' />
    <set x='2000' y='380' />
    <set x='1800' y='330' />
    <set x='2500' y='350' />
    <set x='2200' y='270' />
  </dataset>

</chart>
You can configure the cosmetics of the regression lines using the following attributes:
| Attribute Name | Range | Description |
| regressionLineColor
Since v3.2.2 |
Hex Color | This attribute allows you to set the color of the regression line |
| regressionLineThickness
Since v3.2.2 |
Number | This attribute allows you to set the thickness of the regression line |
| regressionLineAlpha
Since v3.2.2 |
0-100 | This attribute allows you to set the transparency of the regression line |