The linear gauge is essentially a slider component with many additional features. It uses a horizontal scale to display your data range and a fully configurable data pointer (or multiple pointers) is used to indicate the data value.
The FusionWidgets XT linear gauge is a real-time gauge, which can update its data at every specified interval, without requiring any page refreshes.
A few of the FusionWidgets XT Linear gauges can be reproduced as under:
 |
 |
 |
 |
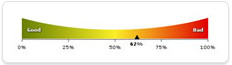
The linear gauge chart is used to display a specific data point utilizing a pointer that moves on a horizontal named color scale to indicate whether the monitored data is within defined limits. Colors can be selected for background to suit the application such as green for satisfactory, yellow for caution and red for alarm.
The chart is defined by minimum and maximum values. Within that scale you can create various ranges to classify your data. Its purpose is to classify that value as belonging to a predetermined range. For example, you might define a range called “Best” that consists of values between 60 and 100. Or you might create a range called “Weak” that consists of values between 30 and 60. For each range, you define a color, which helps visually distinguish the ranges from each other.
The configuration options allow you to configure it into just about any kind of sliding gauge, meter, or mechanism for output. Ideal uses for linear gauge chart are factory/instrument gauges, range meter, slider, tank or vessel fill indicator, Pipe, Volt/Amp/Ohm Meter to name just a few.
To create a FusionWidgets XT Linear Gauge chart, you need to:
- Decide the lower limit and upper limit for the chart.
- Decide the visual properties of the chart
- Decide the color range for the chart. That is, suppose you are plotting a chart to show the magnitude of severity of an Earthquake on a Richter scale, the color range will be:
0-2 – Micro – Green
2-6 – Moderate - Yellow
6-9 – Strong - Red - Decide the chart value
Let’s study the anatomy of a linear gauge next.