Here, we're going to create a simple Gantt chart using FusionWidgets XT. We'll try to keep things as simple as possible in this example and keep on learning new things incrementally in the forthcoming sections.
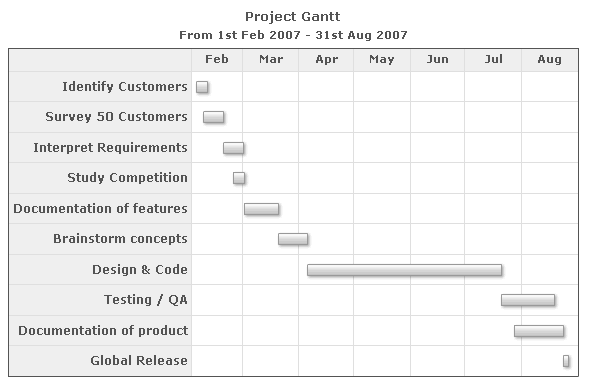
The chart will look as under:
To create a Gantt chart using FusionWidgets XT, you need to take the following steps:
- Decide on the data you want to plot.
- Convert the data into XML/JSON either manually or using your scripts (and database)
- Embed the Gantt chart in HTML page and pass the reference to the above created XML/JSON file
Here, we'll focus on the XML/JSON structure of the Gantt, as inclusion in HTML page has already been discussed in the Creating your first chart section. So, let's first decide on the data that we'll be plotting.
As the simplest example, we'll plot the timeline of a fictitious project let's say "Project Gantt". This project has multiple sub-tasks which we'll be plotting on a Gantt chart to visually illustrate the timeline.
Let's see the data for the chart in tabular format. All dates are in mm/dd/yyyy format.
| Process Name | Start Date | End Date |
| Project Gantt | 02/01/2007 | 08/31/2007 |
| Identify Customers | 02/04/2007 | 02/10/2007 |
| Survey 50 Customers | 02/08/2007 | 02/19/2007 |
| Interpret Requirements | 02/19/2007 | 03/02/2007 |
| Study Competition | 02/24/2007 | 03/02/2007 |
| Documentation of features | 03/02/2007 | 03/21/2007 |
| Brainstorm concepts | 03/21/2007 | 04/06/2007 |
| Design & Code | 04/06/2007 | 07/21/2007 |
| Testing / QA | 07/21/2007 | 08/19/2007 |
| Documentation of product | 07/28/2007 | 08/24/2007 |
| Global Release | 08/24/2007 | 08/27/2007 |
As you can see above, we've:
- Distributed the entire project into processes (sub-tasks)
- Specified a start date and end date for each process.
To build the data for above chart, we need to:
- Specify the dateFormat attribute and other attributes for the <chart> element
- Add the <categories> element - each <categories> element represents a visual timeline. In our chart, we've just 1 visual timeline representing each month's name, so we'll just have 1 <categories> element.
- Add the chart processes under <processes> element.
- Add tasks for each process and specify the starting and ending date for them.
- Customize few cosmetics.
The final XML/JSON for the chart will look as under:
<chart dateFormat="mm/dd/yyyy" caption="Project Gantt" subCaption="From 1st Feb 2007 - 31st Aug 2007">
  <categories>
    <category start="02/01/2007" end="03/01/2007" label="Feb"/>
    <category start="03/01/2007" end="04/01/2007" label="Mar"/>
    <category start="04/01/2007" end="05/01/2007" label="Apr"/>
    <category start="05/01/2007" end="06/01/2007" label="May"/>
    <category start="06/01/2007" end="07/01/2007" label="Jun"/>
    <category start="07/01/2007" end="08/01/2007" label="Jul"/>
    <category start="08/01/2007" end="09/01/2007" label="Aug"/>
  </categories>
  <processes fontSize="12" isBold="1" align="right">
    <process label="Identify Customers"/>
    <process label="Survey 50 Customers"/>
    <process label="Interpret Requirements"/>
    <process label="Study Competition"/>
    <process label="Documentation of features"/>
    <process label="Brainstorm concepts"/>
    <process label="Design & Code"/>
    <process label="Testing / QA"/>
    <process label="Documentation of product"/>
    <process label="Global Release"/>
  </processes>
  <tasks>
    <task start="02/04/2007" end="02/10/2007"/>
    <task start="02/08/2007" end="02/19/2007"/>
    <task start="02/19/2007" end="03/02/2007"/>
    <task start="02/24/2007" end="03/02/2007"/>
    <task start="03/02/2007" end="03/21/2007"/>
    <task start="03/21/2007" end="04/06/2007"/>
    <task start="04/06/2007" end="07/21/2007"/>
    <task start="07/21/2007" end="08/19/2007"/>
    <task start="07/28/2007" end="08/24/2007"/>
    <task start="08/24/2007" end="08/27/2007"/>
  </tasks>
</chart>
{
  "chart": {
    "dateformat": "mm/dd/yyyy",
    "caption": "Project Gantt",
    "subcaption": "From 1st Feb 2007 - 31st Aug 2007"
  },
  "categories": [
    {
      "category": [
        {
          "start": "02/01/2007",
          "end": "03/01/2007",
          "label": "Feb"
        },
        {
          "start": "03/01/2007",
          "end": "04/01/2007",
          "label": "Mar"
        },
        {
          "start": "04/01/2007",
          "end": "05/01/2007",
          "label": "Apr"
        },
        {
          "start": "05/01/2007",
          "end": "06/01/2007",
          "label": "May"
        },
        {
          "start": "06/01/2007",
          "end": "07/01/2007",
          "label": "Jun"
        },
        {
          "start": "07/01/2007",
          "end": "08/01/2007",
          "label": "Jul"
        },
        {
          "start": "08/01/2007",
          "end": "09/01/2007",
          "label": "Aug"
        }
      ]
    }
  ],
  "processes": {
    "fontsize": "12",
    "isbold": "1",
    "align": "right",
    "process": [
      {
        "label": "Identify Customers"
      },
      {
        "label": "Survey 50 Customers"
      },
      {
        "label": "Interpret Requirements"
      },
      {
        "label": "Study Competition"
      },
      {
        "label": "Documentation of features"
      },
      {
        "label": "Brainstorm concepts"
      },
      {
        "label": "Design & Code"
      },
      {
        "label": "Testing / QA"
      },
      {
        "label": "Documentation of product"
      },
      {
        "label": "Global Release"
      }
    ]
  },
  "tasks": {
    "task": [
      {
        "start": "02/04/2007",
        "end": "02/10/2007"
      },
      {
        "start": "02/08/2007",
        "end": "02/19/2007"
      },
      {
        "start": "02/19/2007",
        "end": "03/02/2007"
      },
      {
        "start": "02/24/2007",
        "end": "03/02/2007"
      },
      {
        "start": "03/02/2007",
        "end": "03/21/2007"
      },
      {
        "start": "03/21/2007",
        "end": "04/06/2007"
      },
      {
        "start": "04/06/2007",
        "end": "07/21/2007"
      },
      {
        "start": "07/21/2007",
        "end": "08/19/2007"
      },
      {
        "start": "07/28/2007",
        "end": "08/24/2007"
      },
      {
        "start": "08/24/2007",
        "end": "08/27/2007"
      }
    ]
  }
}
The Gantt chart for the above data will look as under:
Like all other charts in FusionCharts XT and FusionWidgets XT, the root element of the Gantt chart is <chart>. This element can accept a lot of attributes, which decide the functional and cosmetic properties of the chart. The entire list of properties is discussed in the XML Sheet page. Here, we'll discuss only the properties relevant to this chart.
The most important (and mandatory) attribute for the <chart> element is the dateFormat. This attribute lets you specify the format of your dates in XML. For example, in our case, we've specified the dates in the mm/dd/yyyy format. As such, we need to tell the Gantt chart that we're specifying the date in mm/dd/yyyy format. Otherwise, the chart will not be able to interpret dates and will not render properly.
FusionWidgets XT allows you to specify the date in any one of the following formats. As such, the dateFormat attribute can take any one of these values and all your dates specified in the data should conform to that format.
- mm/dd/yyyy
- dd/mm/yyyy
- yyyy/mm/dd
To keep things simple here, we're not discussing time as part of date. We've covered that in the section "Time based charts".
We specify the caption and sub-caption for the chart using the following attributes of <chart> element:
- caption='Project Gantt'
- subCaption='From 1st Feb 2007 - 31st Aug 2007'
Next, we define the visual timeline for the chart. FusionWidgets XT Gantt chart allows you to define any number of date categories on the chart and even irregular ones too. In our chart, since we're just showing the months (as shown below), we've defined only 1 <categories> element.
Within the <categories> element, you can define the sub-categories, which are actually the divisions that you want for the category. We've divided our main category into months and as such each category represents 1 month. For each category, you can define your custom label and more cosmetics (discussed in XML sheet).
Our XML/JSON for visual date scale looks as under:
<categories>
  <category start="02/01/2007" end="03/01/2007" label="Feb"/>
  <category start="03/01/2007" end="04/01/2007" label="Mar"/>
  <category start="04/01/2007" end="05/01/2007" label="Apr"/>
  <category start="05/01/2007" end="06/01/2007" label="May"/>
  <category start="06/01/2007" end="07/01/2007" label="Jun"/>
  <category start="07/01/2007" end="08/01/2007" label="Jul"/>
  <category start="08/01/2007" end="09/01/2007" label="Aug"/>
</categories>
"categories": [
    {
      "category": [
        {
          "start": "02/01/2007",
          "end": "03/01/2007",
          "label": "Feb"
        },
        {
          "start": "03/01/2007",
          "end": "04/01/2007",
          "label": "Mar"
        },
        {
          "start": "04/01/2007",
          "end": "05/01/2007",
          "label": "Apr"
        },
        {
          "start": "05/01/2007",
          "end": "06/01/2007",
          "label": "May"
        },
        {
          "start": "06/01/2007",
          "end": "07/01/2007",
          "label": "Jun"
        },
        {
          "start": "07/01/2007",
          "end": "08/01/2007",
          "label": "Jul"
        },
        {
          "start": "08/01/2007",
          "end": "09/01/2007",
          "label": "Aug"
        }
      ]
    }
]<chart...>
...
<categories>
<category start="02/01/2007" end="04/01/2007" label="Q1"/>
<category start="04/01/2007" end="07/01/2007" label="Q2"/>
<category start="07/01/2007" end="09/01/2007" label="Q3"/>
</categories>
<categories>
<category start="02/01/2007" end="03/01/2007" label="Feb"/>
<category start="03/01/2007" end="04/01/2007" label="Mar"/>
<category start="04/01/2007" end="05/01/2007" label="Apr"/>
<category start="05/01/2007" end="06/01/2007" label="May"/>
<category start="06/01/2007" end="07/01/2007" label="Jun"/>
<category start="07/01/2007" end="08/01/2007" label="Jul"/>
<category start="08/01/2007" end="09/01/2007" label="Aug"/>
</categories>
...
</chart>
{
  "chart": {},
  ...
  "categories": [
    {
      "category": [
        {
          "start": "02/01/2007",
          "end": "04/01/2007",
          "label": "Q1"
        },
        {
          "start": "04/01/2007",
          "end": "07/01/2007",
          "label": "Q2"
        },
        {
          "start": "07/01/2007",
          "end": "09/01/2007",
          "label": "Q3"
        }
      ]
    },
    {
      "category": [
        {
          "start": "02/01/2007",
          "end": "03/01/2007",
          "label": "Feb"
        },
        {
          "start": "03/01/2007",
          "end": "04/01/2007",
          "label": "Mar"
        },
        {
          "start": "04/01/2007",
          "end": "05/01/2007",
          "label": "Apr"
        },
        {
          "start": "05/01/2007",
          "end": "06/01/2007",
          "label": "May"
        },
        {
          "start": "06/01/2007",
          "end": "07/01/2007",
          "label": "Jun"
        },
        {
          "start": "07/01/2007",
          "end": "08/01/2007",
          "label": "Jul"
        },
        {
          "start": "08/01/2007",
          "end": "09/01/2007",
          "label": "Aug"
        }
      ]
      ...
    }
  ]
}
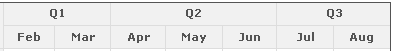
Similarly, you can add weeks, days, hours, minutes, etc. as sub-categories too. The idea is to add as many categories as you need with each sub-category containing the start and end date. You'll just need to keep the following considerations in mind:
- The start and end of each <category> should be same - as all the categories represent the same duration, just using different units.
- The sub-category of each category should be so defined that they cover the entire duration and the dates of two sub-categories never overlap.
- The dates of sub-category represent a date within the date frame of the chart. For example, in our Quarter division, we've set the dates for Q1 as 02/01/2007-04/01/2007, as the date frame of chart is 02/01/2007-08/31/2007. If we set Q1 as 01/01/2007-04/01/2007, the chart will change the date frame to 01/01/2007-08/31/2007.
Next, we define the list of processes for the chart using the <processes> element. This element can assume a lot of visual and functional attributes, which have been discussed in XML sheet. Here, we just specify a few attributes to change the cosmetics.
Each <process> element within the <processes> element represents a single process on the chart.
<processes fontSize="12" isBold="1" align="right">
  <process label="Identify Customers"/>
  <process label="Survey 50 Customers"/>
  <process label="Interpret Requirements"/>
  <process label="Study Competition"/>
  <process label="Documentation of features"/>
  <process label="Brainstorm concepts"/>
  <process label="Design & Code"/>
  <process label="Testing / QA"/>
  <process label="Documentation of product"/>
  <process label="Global Release"/>
</processes>
"processes": {
    "fontsize": "12",
    "isbold": "1",
    "align": "right",
    "process": [
      {
        "label": "Identify Customers"
      },
      {
        "label": "Survey 50 Customers"
      },
      {
        "label": "Interpret Requirements"
      },
      {
        "label": "Study Competition"
      },
      {
        "label": "Documentation of features"
      },
      {
        "label": "Brainstorm concepts"
      },
      {
        "label": "Design & Code"
      },
      {
        "label": "Testing / QA"
      },
      {
        "label": "Documentation of product"
      },
      {
        "label": "Global Release"
      }
    ]
}<tasks>
<task start="02/04/2007" end="02/10/2007"/>
<task start="02/08/2007" end="02/19/2007"/>
<task start="02/19/2007" end="03/02/2007"/>
<task start="02/24/2007" end="03/02/2007"/>
<task start="03/02/2007" end="03/21/2007"/>
<task start="03/21/2007" end="04/06/2007"/>
<task start="04/06/2007" end="07/21/2007"/>
<task start="07/21/2007" end="08/19/2007"/>
<task start="07/28/2007" end="08/24/2007"/>
<task start="08/24/2007" end="08/27/2007"/>
</tasks>
"tasks": {
    "task": [
      {
        "start": "02/04/2007",
        "end": "02/10/2007"
      },
      {
        "start": "02/08/2007",
        "end": "02/19/2007"
      },
      {
        "start": "02/19/2007",
        "end": "03/02/2007"
      },
      {
        "start": "02/24/2007",
        "end": "03/02/2007"
      },
      {
        "start": "03/02/2007",
        "end": "03/21/2007"
      },
      {
        "start": "03/21/2007",
        "end": "04/06/2007"
      },
      {
        "start": "04/06/2007",
        "end": "07/21/2007"
      },
      {
        "start": "07/21/2007",
        "end": "08/19/2007"
      },
      {
        "start": "07/28/2007",
        "end": "08/24/2007"
      },
      {
        "start": "08/24/2007",
        "end": "08/27/2007"
      }
    ]
  }
When specifying the dates for tasks, you need to make sure that:
- The date defined for each task should conform to the dateFormat specified earlier.
- The end date for a task should always be more than the start date.
- The date for any task should be within the date frame of the chart (i.e., the date frame defined by chart categories).
For detailed explanation on JSON data format click here.
Now that our first chart is done, we'll look into a few of the basic chart configuration properties in the next section.