Starting FusionWidgets XT, charts/gauges can be rendered using JSON (JavaScript Object Notation) data. JSON is a light-weight and simple data format that is easy to read and understand. Though derived from JavaScript, the data structure is language-independent, with encoders and parsers available for virtually every programming language.
- JSON data is text based data consisting of key and value pairs in format key : value . The values have data associated with them
- You can make up your own key-value pairs like name : "John Doe" to store data
- Every JSON data is enveloped by curly brace and key:value pairs are comma separated, like { firstName : "John" , lastName: "Doe" }. In JavaScript, this format is called an Object
- A key can be a value within single or double-quotes e.g. { "name" : "John Doe" }
- You can use Objects as values too. For example, { "employee" : { "name" : "John Doe" , "department" : "Project Manager" , "age" : 35 } }
- In JSON, the basic data types are:
- Number (integer or real)
- String (double-quoted Unicode with backslash escaping)
- Boolean (1 or 0 in FusionCharts JSON)
- null
- Array (an ordered sequence of values of Number, String, Boolean, null, Object or Array type, comma-separated and enclosed in square brackets) e.g. [ "employees" : [ "Employees" , { "name" : "John Doe" } , 35 ]
- Object (a collection of key:value pairs, comma-separated and enclosed in curly braces. Value can be of Number, String, Boolean, null, Object or Array type) e.g. { "employee" : { "name" : "John Doe" , "department" : "Project Manager" , "age" : 35 } }
A FusionWidgets XT chart is controlled by a single JSON data source i.e., the same source contains data to plot, functional settings and cosmetic properties. There are many properties that you can define for each chart type. However, it is not necessary to define all the properties for a given chart. For example, if you do not want to change the default setting of the canvas (color, alpha etc.), you don't have to define any property for the canvas - the default values will be assumed. Thus, each chart can be generated using minimal properties.
In this page, we will discuss about how to use JSON data to create a Gantt chart.
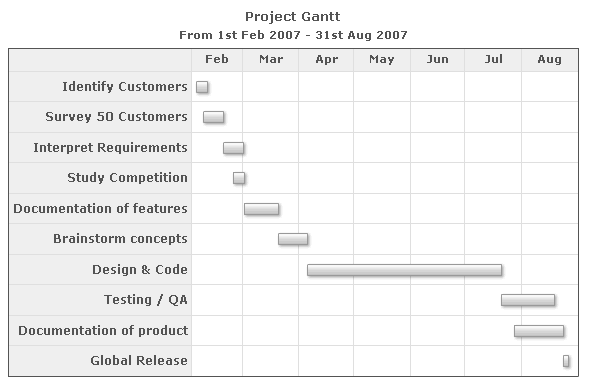
A sample JSON data for a Gantt chart looks as under:
{
  "chart": {
    "dateformat": "mm/dd/yyyy",
    "caption": "Project Gantt",
    "subcaption": "From 1st Feb 2007 - 31st Aug 2007"
  },
  "categories": [
    {
      "category": [
        {
          "start": "02/01/2007",
          "end": "03/01/2007",
          "label": "Feb"
        },
        {
          "start": "03/01/2007",
          "end": "04/01/2007",
          "label": "Mar"
        },
        {
          "start": "04/01/2007",
          "end": "05/01/2007",
          "label": "Apr"
        },
        {
          "start": "05/01/2007",
          "end": "06/01/2007",
          "label": "May"
        },
        {
          "start": "06/01/2007",
          "end": "07/01/2007",
          "label": "Jun"
        },
        {
          "start": "07/01/2007",
          "end": "08/01/2007",
          "label": "Jul"
        },
        {
          "start": "08/01/2007",
          "end": "09/01/2007",
          "label": "Aug"
        }
      ]
    }
  ],
  "processes": {
    "fontsize": "12",
    "isbold": "1",
    "align": "right",
    "process": [
      {
        "label": "Identify Customers"
      },
      {
        "label": "Survey 50 Customers"
      },
      {
        "label": "Interpret Requirements"
      },
      {
        "label": "Study Competition"
      },
      {
        "label": "Documentation of features"
      },
      {
        "label": "Brainstorm concepts"
      },
      {
        "label": "Design & Code"
      },
      {
        "label": "Testing / QA"
      },
      {
        "label": "Documentation of product"
      },
      {
        "label": "Global Release"
      }
    ]
  },
  "tasks": {
    "task": [
      {
        "start": "02/04/2007",
        "end": "02/10/2007"
      },
      {
        "start": "02/08/2007",
        "end": "02/19/2007"
      },
      {
        "start": "02/19/2007",
        "end": "03/02/2007"
      },
      {
        "start": "02/24/2007",
        "end": "03/02/2007"
      },
      {
        "start": "03/02/2007",
        "end": "03/21/2007"
      },
      {
        "start": "03/21/2007",
        "end": "04/06/2007"
      },
      {
        "start": "04/06/2007",
        "end": "07/21/2007"
      },
      {
        "start": "07/21/2007",
        "end": "08/19/2007"
      },
      {
        "start": "07/28/2007",
        "end": "08/24/2007"
      },
      {
        "start": "08/24/2007",
        "end": "08/27/2007"
      }
    ]
  }
}
chart object and its attributes:
The chart Object defines all the settings that help to manipulate the chart. You can find the list of all the attributes for this Object in the XML API of Gantt chart.
In the most general form, chart attributes represent the following JSON format:
"attributeName" : "Value"
e.g., "caption" : "Project Gantt"
The attributes can be arranged in any order, with values either in single or in double quotes, like caption:'Project Gantt'. However,
you need to make sure that a particular attribute occurs only once for
a given element.
Please note that the XML attributes declared in the XML API for Gantt chart are same as the JSON keys in FusionWidgets XT JSON data format.
Defining the visual timeline for the chart using the categories array:
After the chart Object, comes the categories Array. The categories Array contains one or more Objects each of which refers to a visual timeline. For example, the first timeline can define a particular year, while another can define all the quarters and a third timeline can define the months. Each such Object contains a category Array. Each element of this Array defines the sub-categories or divisions of the particular timeline. FusionWidgets XT Gantt chart allows you to define any number of sub-categories to show dates broken into smaller units as shown below:
{
  "chart": {},
  ...
  "categories": [
    {
      "category": [
        {
          "start": "01/01/2007",
          "end": "04/01/2007",
          "label": "Q1"
        },
        {
          "start": "04/01/2007",
          "end": "07/01/2007",
          "label": "Q2"
        },
		...
      ]
    },
    {
      "category": [
        {
          "start": "01/01/2007",
          "end": "02/01/2007",
          "label": "Jan"
        },
        {
          "start": "02/01/2007",
          "end": "03/01/2007",
          "label": "Feb"
        },
        {
          "start": "03/01/2007",
          "end": "04/01/2007",
          "label": "Mar"
        },
        {
          "start": "04/01/2007",
          "end": "05/01/2007",
          "label": "Apr"
        },
        {
          "start": "05/01/2007",
          "end": "06/01/2007",
          "label": "May"
        },

...
      ]
      ...
    }
  ]
}
You can add innumerable number of categories. However, you need to ensure that each sub-category is within the start and end dates. To add more categories, you need to keep the following considerations in mind:
- The start and end of each category attribute should be same, as all the categories represent the same duration, just using different units.
- The sub-category of each category should be so defined that they cover the entire duration and the dates of two sub-categories never overlap.
- The dates of sub-category represent a date within the date frame of the chart.
Defining processes for the chart:
Next, we define the list of processes for the chart using the processes Array. You can configure plenty of visual and functional properties for this element, which have been discussed in the XML sheet.
All processes are defined within the processes Object. The attributes related to all processes are defined as key-value pairs in the processes Object. It also defines an Array named process. Each Object within the process Array represents a single process on the chart.
"processes": {
    "fontsize": "12",
    "isbold": "1",
    "align": "right",
    "process": [
      {
        "label": "Identify Customers"
      },
      {
        "label": "Survey 50 Customers"
      },
      {
        "label": "Interpret Requirements"
      },
      {
        "label": "Study Competition"
      },
      {
        "label": "Documentation of features"
      },
      {
        "label": "Brainstorm concepts"
      },
      {
        "label": "Design & Code"
      },
      {
        "label": "Testing / QA"
      },
      {
        "label": "Documentation of product"
      },
      {
        "label": "Global Release"
      }
    ]
  }
Defining the tasks:
Finally, we define the tasks for the chart within the tasks Object. The tasks Object contains an Array named task. Each element of this Array defines a task. Each task represents a horizontal bar on the chart, spanning from the specified start date to end date. The tasks Object and each Object in the task Array can have a number of additional cosmetic and functional properties which have been defined in the XML Sheet.
"tasks": {
    "task": [
      {
        "start": "02/04/2007",
        "end": "02/10/2007"
      },
      {
        "start": "02/08/2007",
        "end": "02/19/2007"
      },
      {
        "start": "02/19/2007",
        "end": "03/02/2007"
      },
      {
        "start": "02/24/2007",
        "end": "03/02/2007"
      },
      {
        "start": "03/02/2007",
        "end": "03/21/2007"
      },
      {
        "start": "03/21/2007",
        "end": "04/06/2007"
      },
      {
        "start": "04/06/2007",
        "end": "07/21/2007"
      },
      {
        "start": "07/21/2007",
        "end": "08/19/2007"
      },
      {
        "start": "07/28/2007",
        "end": "08/24/2007"
      },
      {
        "start": "08/24/2007",
        "end": "08/27/2007"
      }
    ]
  }
When specifying the dates for tasks, you need to make sure that:
- The date defined for each task should conform to the date format specified within the chart Object.
- The end date for a task should always be more than the start date.
- The date for any task should be within the date frame of the chart (i.e., the date frame defined by chart categories).
Important: To use JSON data format with FusionWidgets XT, you'll need to embed the charts using FusionCharts JavaScript Class (FusionCharts.js), as the charts internally still use XML. The JavaScript class provides the bridge between JSON and XML.