In the previous section, we had explained how FusionWidgets XT can be used with server-side scripts. These scripts can, in turn, connect to databases, web services or other live data sources and provide dynamic data to FusionWidgets XT. This enables you to use FusionWidgets XT for real-time charting. It means that whenever the chart is rendered, it gets the latest data from database and plots the same. FusionWidgets XT works with all databases including MS SQL, Oracle, MySQL, PostgreSQL, CSV or even legacy data storage.
Creating a chart using dynamic data from database involves following steps:
- Initiate database connection in your server-side script.
- Retrieve the data from database that you wish to show on the chart.
- Generate chart data (XML or JSON) by iterating through each record. This can be either done using simple String concatenation or, using XML/JSON objects if your server-side scripts support the same. For ASP and PHP, we've APIs that help you convert arrays and recordsets into FusionWidgets XT XML format.
- Provide the chart data to the chart as string/URL. No need to save/store them on server as physical files; you can virtually relay them.
Data can be provided to charts using following two methods:
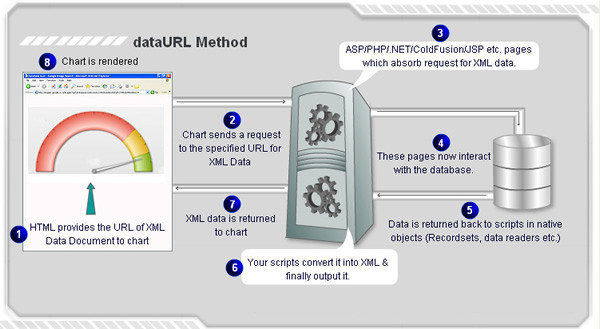
- Data URL - In this method, a URL is provided to the chart as the Data source. The chart, upon loading or while updating, invokes this URL and reads the XML or JSON data transmitted from the URL.
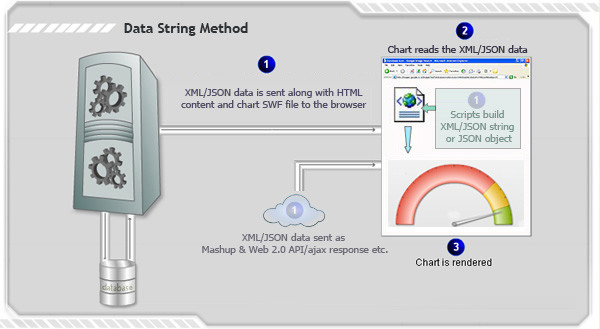
- Data String - In this method, the entire data (XML or JSON) is provided as a string embedded in the same page as the chart. When the chart loads, it reads the Data String and plots data accordingly.
Following illustrations provide an overview of each method:
Data URL method
Data String method
For quick reference to create charts using dynamic data from database and using various server-side scripting languages you may use the following links:
- Using ASP and MSSQL/MS Access to create database driven charts
- Using PHP and MYSQL to create database driven charts
- Using J2EE to create database driven charts
- Using ColdFusion to create database driven charts
- Using VB.NET and MSSQL/MS Access to create database driven charts
- Using C#.NET and MSSQL/MS Access to create database driven charts
- Using Ruby on Rails to create database driven charts