When you've multiple charts present on your page, there are three ways to export them using Export Component:
- One to one - Each chart in the page has its own instance of Export Component and they export to the same. This is the easiest to setup and allows you to place the Export UI for each chart wherever you wish it to be.
- Many to one - In this mode, there is only one instance of Export Component. Multiple charts export their data to this instance. This instance then shows up a UI, wherein users can select which chart they want to save, as well as the export format.
- Batch Export Mode - In this mode, again there is only one instance of Export Component. Multiple charts export their data to this instance. The difference is that in this mode, the output file can be a single file (that contains images of all the charts). Additionally, there are APIs that help you automatically export all the charts in the page.
To aid your understanding of this section, we will recommend you to go through the Overview page of Exporting Charts as PDF or Images > Client-side export
| Feature | One to One | Many to one | Batch Mode |
| Number of export component instances | One export component instance per chart in the page | Only one export component in the page. | Only one export component in the page. |
| Possible triggers for export | Both context menu and JavaScript API | Both context menu and JavaScript API | JavaScript APIs pertaining to batch export. These APIs allow you to specify which charts to export in batch, and also to export all charts present in the page |
| User Interface Mode of Export Component | Compact | Full | Both Compact & Full. But Full is recommended. |
| Where to specify export related parameters? | In XML | In XML. | In XML. But all the parameters can be over-written collectively for the charts using the JavaScript API. |
| Number of Output Export Files | One output file per chart | One output file per chart | Both - one per chart, a single file containing all charts |
This is the simplest saving mode when you've multiple charts in your page. In this mode, you basically create one instance of Export Component per chart, and link the same in chart's XML. Consider the XML code for 2 charts below:
<chart exportEnabled='1' exportAtClient='1' exportHandler='fcExporter2' caption='Top 5 Sales Person' numberPrefix='$' bgColor='FFFFFF,FFFFFF' showBorder='0' >
    <set label='Alex' value='25000'  />
    <set label='Mark' value='35000' />
    <set label='David' value='42300' />
    <set label='Graham' value='35300' />
    <set label='John' value='31300' />
</chart>
Chart 2:
<chart exportEnabled='1' exportAtClient='1' exportHandler='fcExporter2' lowerLimit='0' upperLimit='100' lowerLimitDisplay='Bad' upperLimitDisplay='Good' numberSuffix='%' showValue='1' showBorder='0' bgColor='FFFFFF,FFFFFF' tickValueDistance='20'>
    <colorRange>
        <color minValue='0' maxValue='75' code='FF654F' />
        <color minValue='75' maxValue='90' code='F6BD0F' />
        <color minValue='90' maxValue='100' code='8BBA00' />
    </colorRange>
    <dials>
    	<dial value='92' />
    </dials>
</chart>
Note that the only difference between the two XMLs is reference to client-side Export Handler - namely fcExporter1 and fcExporter2. And the HTML code that defines these two charts and their handlers can be listed as under:
<html>
<head>
	<script language="JavaScript" src="../../Charts/FusionCharts.js"></script>
	<script language="JavaScript" src="../../Charts/FusionChartsExportComponent.js"></script>
</head>
<body bgcolor="#ffffff">

	<div id="chartdiv" align="center">The chart will appear within this DIV. This text will be replaced by the chart.</div>
	<script type="text/javascript">
		var myChart = new FusionCharts("../../Charts/Pyramid.swf", "myChartId", "500", "300", "0", "1");
		myChart.setXMLUrl("SimpleExample.xml");
		myChart.render("chartdiv");
	</script>
	<div id="fcexpDiv" align="center">FusionCharts Export Handler Component</div>
	<script type="text/javascript">
		var myExportComponent = new FusionChartsExportObject("fcExporter1", "../../Charts/FCExporter.swf");
		myExportComponent.Render("fcexpDiv");
	</script>

	<div id="chartdiv2" align="center">The chart will appear within this DIV. This text will be replaced by the chart.</div>
	<script type="text/javascript">
		var myChart2 = new FusionCharts("../../Charts/AngularGauge.swf", "myChartId2", "500", "300", "0", "1");
		myChart2.setXMLUrl("SimpleExample2.xml");
		myChart2.render("chartdiv2");
	</script>
	<div id="fcexpDiv2" align="center">FusionCharts Export Handler Component</div>
	<script type="text/javascript">
		var myExportComponent2 = new FusionChartsExportObject("fcExporter2", "../../Charts/FCExporter.swf");
		myExportComponent2.Render("fcexpDiv2");
	</script>

</body>
</html>
Here, we've created:
- 2 Charts - with DOM Id as myChartId and myChartId2. The first is a Pyramid chart and latter is an Angular gauge.
- 2 Export Component Instances - with DOM Id as fxExporter1 and fxExporter2, as we had earlier specified in chart XML.
To provide cross-browser compatibility, we recommend you not to start the ID with a numerical value, nor use space as part of the ID.
When you now run this page, you'll see 2 charts with their own exporter component. The components allow you to download each chart's individual export file. Shown below is what the page looks like (with 3D chart already been exported).
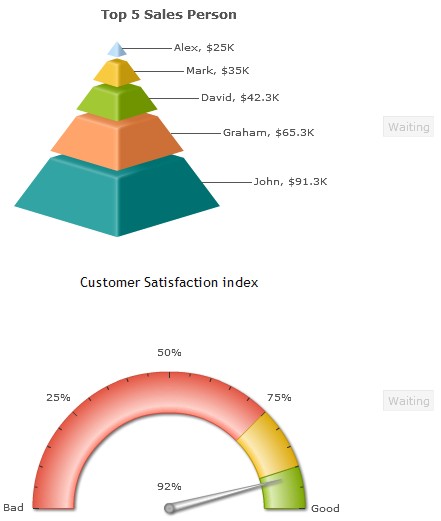
See it live!
Using this method, you can have any number of charts (with their respective export handler instance) in a single web page. Just make sure to link them correctly using the chart XML.
Let us now see how to use a single export component for multiple charts.
To enable a single export component handle multiple charts, we need to:
- Create the only instance of Export Component in the page at a location which you deem apt for your users to click. Like, if your page has a "Configuration panel" or "Actions panel", you can place the instance of Export Component there, so that your users know where to click (to download output files) after exporting chart.
- Create all the charts in the page. Have their XML link to the instance of Export Component that you earlier embedded.
- Customize the export component to show full mode - this allows your users to select individual chart for download, in the format that they need.
Shown below is an example. For this example, all the charts use the same export related attributes. Note that exportHandler of all charts refer to fcExporter1.
<chart exportEnabled='1' exportAtClient='1' exportHandler='fcExporter1' ...>
...
</chart>
The HTML code contains the following:
<html>
<head>
	<script language="JavaScript" src="../../Charts/FusionCharts.js"></script>
	<script language="JavaScript" src="../../Charts/FusionChartsExportComponent.js"></script>
</head>
<body bgcolor="#ffffff">
	<div id="chartdiv" align="center">The chart will appear within this DIV. This text will be replaced by the chart.</div>
	<script type="text/javascript">
		var myChart = new FusionCharts("../../Charts/Pyramid.swf", "myChartId", "500", "300", "0", "1");
		myChart.setXMLUrl("SimpleExample.xml");
		myChart.render("chartdiv");
	</script>
	<div id="chartdiv2" align="center">The chart will appear within this DIV. This text will be replaced by the chart.</div>
	<script type="text/javascript">
		var myChart2 = new FusionCharts("../../Charts/AngularGauge.swf", "myChartId2", "500", "300", "0", "1");
		myChart2.setXMLUrl("SimpleExample.xml");
		myChart2.render("chartdiv2");
	</script>
	<div id="chartdiv3" align="center">The chart will appear within this DIV. This text will be replaced by the chart.</div>
	<script type="text/javascript">
		var myChart3 = new FusionCharts("../../Charts/HBullet.swf", "myChartId3", "500", "300", "0", "1");
		myChart3.setXMLUrl("SimpleExample.xml");
		myChart3.render("chartdiv3");
	</script>
	<div id="chartdiv4" align="center">The chart will appear within this DIV. This text will be replaced by the chart.</div>
	<script type="text/javascript">
		var myChart3 = new FusionCharts("../../Charts/HLinearGauge.swf", "myChartId4", "500", "300", "0", "1");
		myChart4.setXMLUrl("SimpleExample.xml");
		myChart4.render("chartdiv4");
	</script>
	<div id="fcexpDiv" align="center">FusionCharts Export Handler Component</div>
	<script type="text/javascript">
		var myExportComponent = new FusionChartsExportObject("fcExporter1", "../../Charts/FCExporter.swf");
		//Set configuration
		//Full Mode
		myExportComponent.componentAttributes.fullMode = '1';
		//Set saving type to individual
		myExportComponent.componentAttributes.saveMode = 'individual';
		//Show allowed export format drop-down
		myExportComponent.componentAttributes.showAllowedTypes = '1';
		//Width and height
		myExportComponent.componentAttributes.width = '400';
		myExportComponent.componentAttributes.height = '120';
		//Message - caption of export component
		myExportComponent.componentAttributes.showMessage = '1';
		myExportComponent.componentAttributes.message = 'Export any chart from context menu and then use this to save';
		//Set it to show allowed format types as well
		myExportComponent.Render("fcexpDiv");
	</script>
</body>
</html>
In this code, we've:
- Created 4 charts referring to the same export handler fcExporter1. The charts which have been used are: pyramid chart, angular gauge, horizontal bullet graph, and horizontal linear gauge.
- Created an instance of exporter component with DOM Id as fcExporter1.
We've set the component to show in full mode. Additionally, we've set saveMode to individual, which is necessary for Many-to-one Mode. Since we want the users to be able to select the saving format for each chart's export output, we've also set showAllowedTypes to 1. Some other cosmetic configuration parameters have also been set.
When you now run this page, you'll first see three charts and an empty export component on page, as shown below:
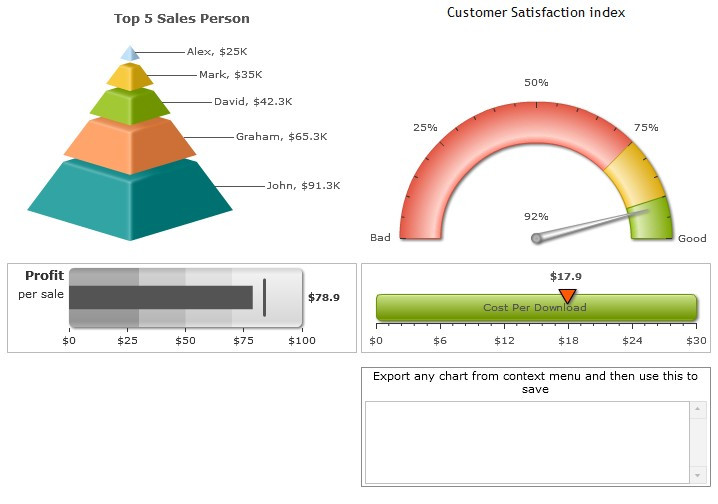
When you now export any chart using its context menu, after export, the chart gets added to the exporter component, as shown below. The caption of the chart is used to list the chart. If caption is not present, a generic title is shown.
As you export other charts, they too get added to the component.
The drop-down box, by default, shows the format which the user selected as output format for the chart in its context menu. However, for each chart, the user can choose a different output format and click on Save button to save the chart, as shown below.
If you, however, do not want the users to be able to select output format here, you can set:
myExportComponent.componentAttributes.showAllowedTypes = '0';
And, this will result in:
The cosmetics of this UI can be extensively configured by specifying the same in your HTML. Please refer to the page Component UI Customization to see the entire list.