FusionWidgets XT introduces LinkedCharts, which is a smart and efficient method of creating drill-down charts. LinkedCharts are not special chart types. Any chart can be used as a LinkedChart. You can create a master summarized chart whose data-plots, when clicked, will create detailed charts. You can define the data-string or data-url of the detailed charts within the data-source of the master chart.
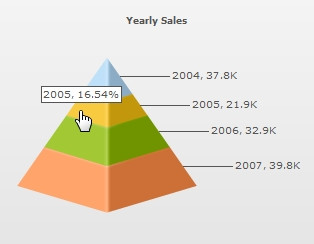
This section shows how to create a single XML data source using data-string for rendering LinkedCharts. For better understanding, we'll create an XML for a column chart – which shows sales for 4 years from 2004-2007. Clicking on a column (say 2005) will bring up another chart showing quarterly sales for that year (see image below).
 |
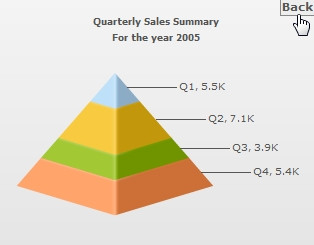 |
| Main chart while the data for year 2005 is clicked | LinkedChart with data for 2005 replaces the main chart |
Watch it live!
To learn how LinkedCharts work, read FusionWidgets XT and JavaScript > Using LinkedCharts page.
Embedded data-string of LinkedCharts in data of master chart
Following XML data contains data for LinkedCharts:
<chart caption="Yearly sales" xAxisName="Year" yAxisName="Sales">
  <set label="2004" value="37800" link="newchart-xml-2004-quarterly" />
  <set label="2005" value="21900" link="newchart-xml-2005-quarterly" />
  <set label="2006" value="32900" link="newchart-xml-2006-quarterly" />
  <set label="2007" value="39800" link="newchart-xml-2007-quarterly" />

  <linkeddata id="2004-quarterly">
    <chart caption="Quarterly Sales Summary" subcaption="For the year 2004"
    xAxisName="Quarter" yAxisName="Sales" >
      <set label="Q1" value="3700" />
      <set label="Q2" value="2900" />
      <set label="Q3" value="3200" />
      <set label="Q4" value="3900" />
    </chart>
  </linkeddata>

  <linkeddata id="2005-quarterly">
    <chart caption="Quarterly Sales Summary" subcaption="For the year 2005"
      xAxisName="Quarter" yAxisName="Sales">
      <set label="Q1" value="7800" />
      <set label="Q2" value="2100" />
      <set label="Q3" value="3290" />
      <set label="Q4" value="3800" />
    </chart>
  </linkeddata>

  <linkeddata id="2006-quarterly">
    <chart caption="Quarterly Sales Summary" subcaption="For the year 2006"
      xAxisName="Quarter" yAxisName="Sales">
      <set label="Q1" value="3800" />
      <set label="Q2" value="2190" />
      <set label="Q3" value="3290" />
      <set label="Q4" value="3980" />
    </chart>
  </linkeddata>

  <linkeddata id="2007-quarterly">
    <chart caption="Quarterly Sales Summary" subcaption="For the year 2007"
      xAxisName="Quarter" yAxisName="Sales">
      <set label="Q1" value="3780" />
      <set label="Q2" value="1900" />
      <set label="Q3" value="2900" />
      <set label="Q4" value="9800" />
    </chart>
  </linkeddata>

</chart>
The initial part of the XML defines the data for the master chart, and rest of the XML is a group of <linkeddata> nodes, each of which contains data for a specific LinkedChart. The XML data for the master chart is as shown follows:
<chart caption="Yearly sales" xAxisName="Year" yAxisName="Sales">
  <set label="2004" value="37800" link="newchart-xml-2004-quarterly" />
  <set label="2005" value="21900" link="newchart-xml-2005-quarterly" />
  <set label="2006" value="32900" link="newchart-xml-2006-quarterly" />
  <set label="2007" value="39800" link="newchart-xml-2007-quarterly" />
  . . .
Note, that every <set> element contains the link attribute. The value of this attribute follows the syntax:
link="newchart-xml-id"
- newchart - indicates that the click action on the dataplot will lead to rendering of a new LinkedChart
- xml - indicates that the new chart will use xml data
- id - this can be any string, and each set element must have a unique link id with the entire XML. This id will be searched in the id attribute of <linkeddata> node later in the XML. Once matched, the chart data present in that node will be used as the data for the LinkedChart, which renders when a particular link is clicked.
Next, separate nodes of chart XML data for each LinkedChart are declared under the <linkeddata> element. Following XML shows one of the nodes, which provides data for a drill-down chart, which renders when the first column of the master chart is clicked:
<linkeddata id="2004-quarterly">
    <chart caption="Quarterly Sales Summary" subcaption="For the year 2004"
    xAxisName="Quarter" yAxisName="Sales" >
      <set label="Q1" value="3700" />
      <set label="Q2" value="2900" />
      <set label="Q3" value="3200" />
      <set label="Q4" value="3900" />
    </chart>
  </linkeddata>
The XML data for drill-down charts is specified under separate <linkeddata> element, and each data node is mapped to its parent dataplot in the master chart by means of a unique id (which is specified in the individual <set> element of the master chart). In the above XML the id of this node is "2004-quarterly". This id matches with the id passed through the first dataplot's link attribute in the XML of the master chart : link="newchart-xml-2004-quarterly". Hence, when the first data-plot is clicked, the chart that opens up will take data from this node.
Note: You can create LinkedCharts using the link attribute of a data plot or the clickURL atttribute of the chart or gauge.
Instead of embedding the data of LinkedCharts inside the data-source of the master chart, you can also specify the data source URL of the LinkedCharts. See the XML below:
<chart caption="Yearly Sales" xAxisName="Year" yAxisName="Sales">
  <set label="2004" value="37800" link="newchart-xmlurl-Data2004.xml" />
  <set label="2005" value="21900" link="newchart-xmlurl-Data2005.xml" />
  <set label="2006" value="32900" link="newchart-xmlurl-Data2006.xml" />
  <set label="2007" value="39800" link="newchart-xmlurl-Data2007.xml" />
</chart>
Note, here also, every <set> element contains the link attribute. The value of this attribute follows the syntax:
link="newchart-xmlurl-url"
- newchart - indicates that the click action on the dataplot will lead to rendering of a new LinkedChart
- xmlurl - indicates that the new chart will get xml data from a URL
- url - sets the url/path of the xml data source
When the first dataplot is clicked, a chart is rendered based on data obtained from the file Data2004.xml.